Free Access
Fig. 6.
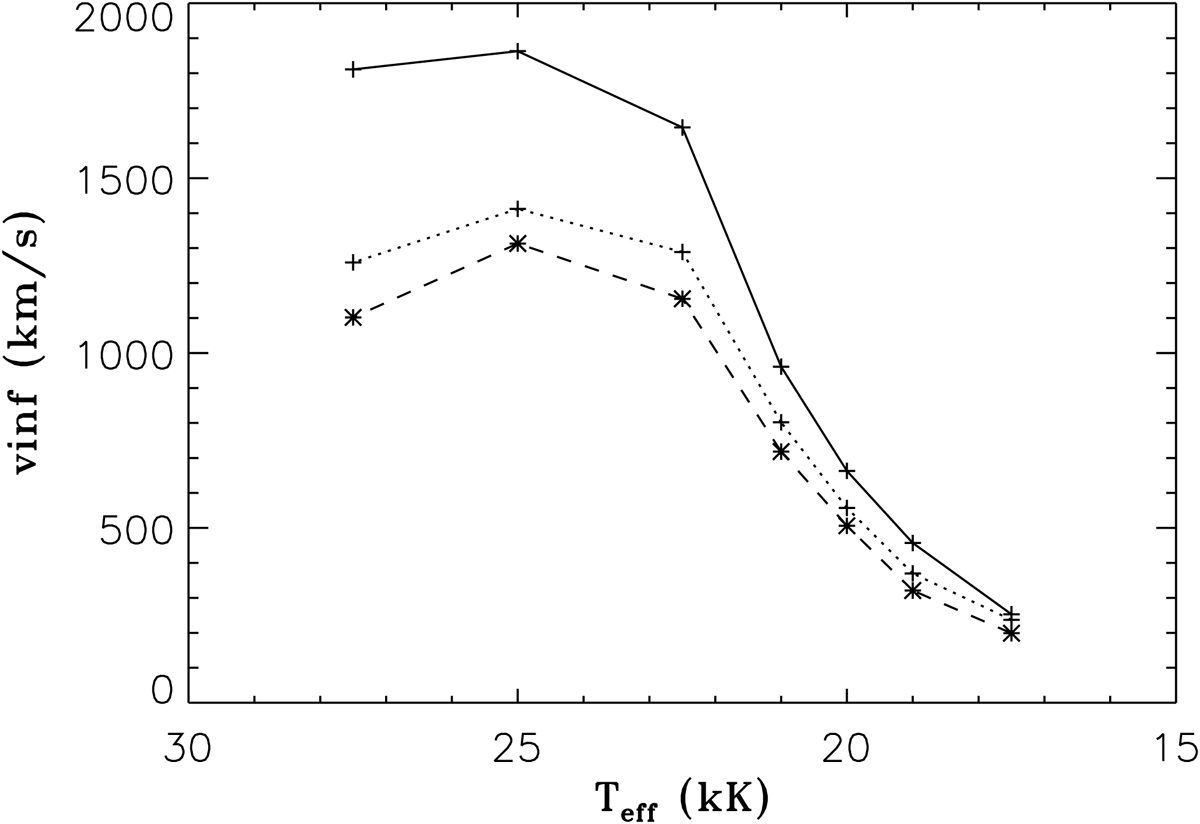
Predicted wind velocity (v∞) vs Teff for the three different LBV mass models. The solid line is for M = 35 M⊙, the dotted line for M = 25 M⊙, whilst the dashed line is for M = 23 M⊙, representing Γ values of respectively 0.5, 0.7, and 0.8.
Current usage metrics show cumulative count of Article Views (full-text article views including HTML views, PDF and ePub downloads, according to the available data) and Abstracts Views on Vision4Press platform.
Data correspond to usage on the plateform after 2015. The current usage metrics is available 48-96 hours after online publication and is updated daily on week days.
Initial download of the metrics may take a while.