Fig. 7.
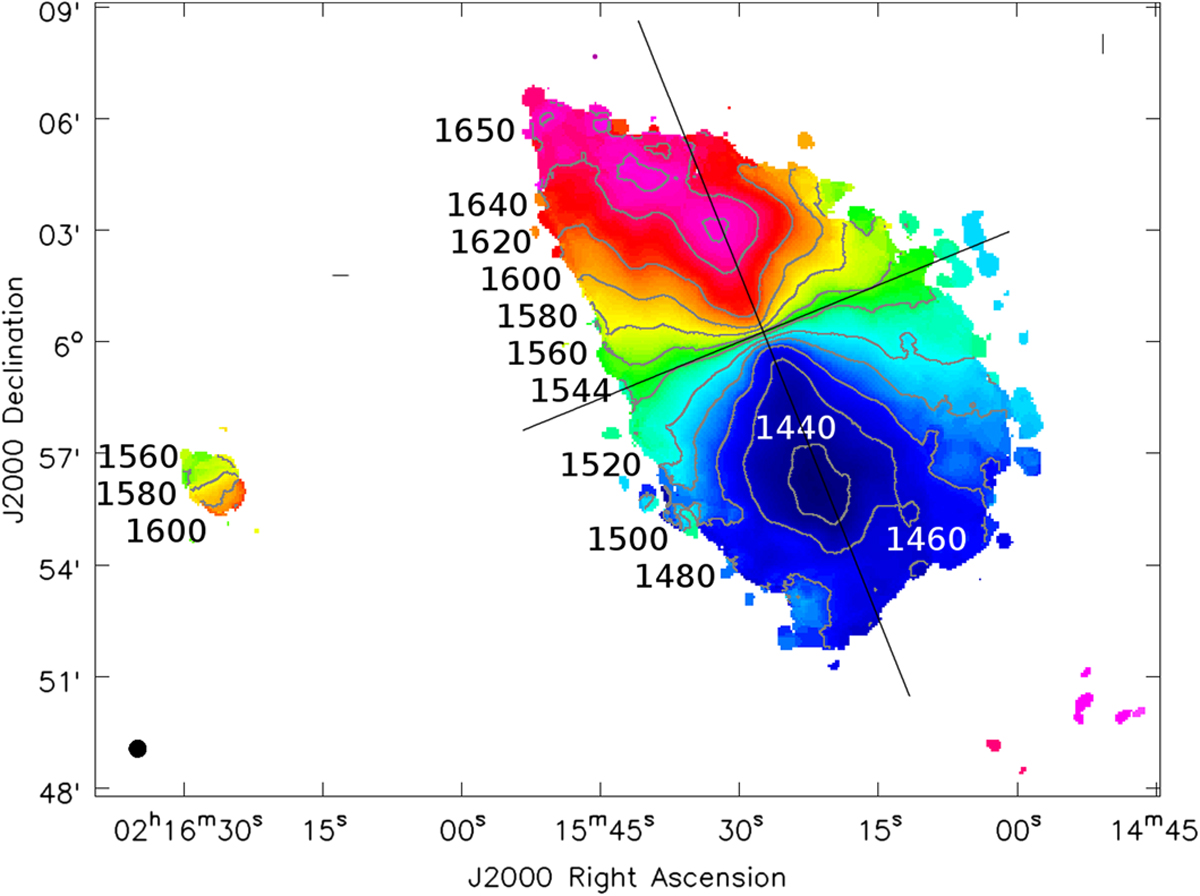
HI velocity field map of CIG 96 and its companion after a 3.5σ blanking (see Sect. 2.3). The black lines indicate the orientation of the major and minor axis (PAmaj = 20° and PAmin = 110°, respectively) along which the position–velocity cuts have been performed (see Fig. 8). Grey contours represent the indicated velocities in km s−1. The black circle at the bottom left represents the beam size of 28″ × 28″.
Current usage metrics show cumulative count of Article Views (full-text article views including HTML views, PDF and ePub downloads, according to the available data) and Abstracts Views on Vision4Press platform.
Data correspond to usage on the plateform after 2015. The current usage metrics is available 48-96 hours after online publication and is updated daily on week days.
Initial download of the metrics may take a while.