Fig. 5.
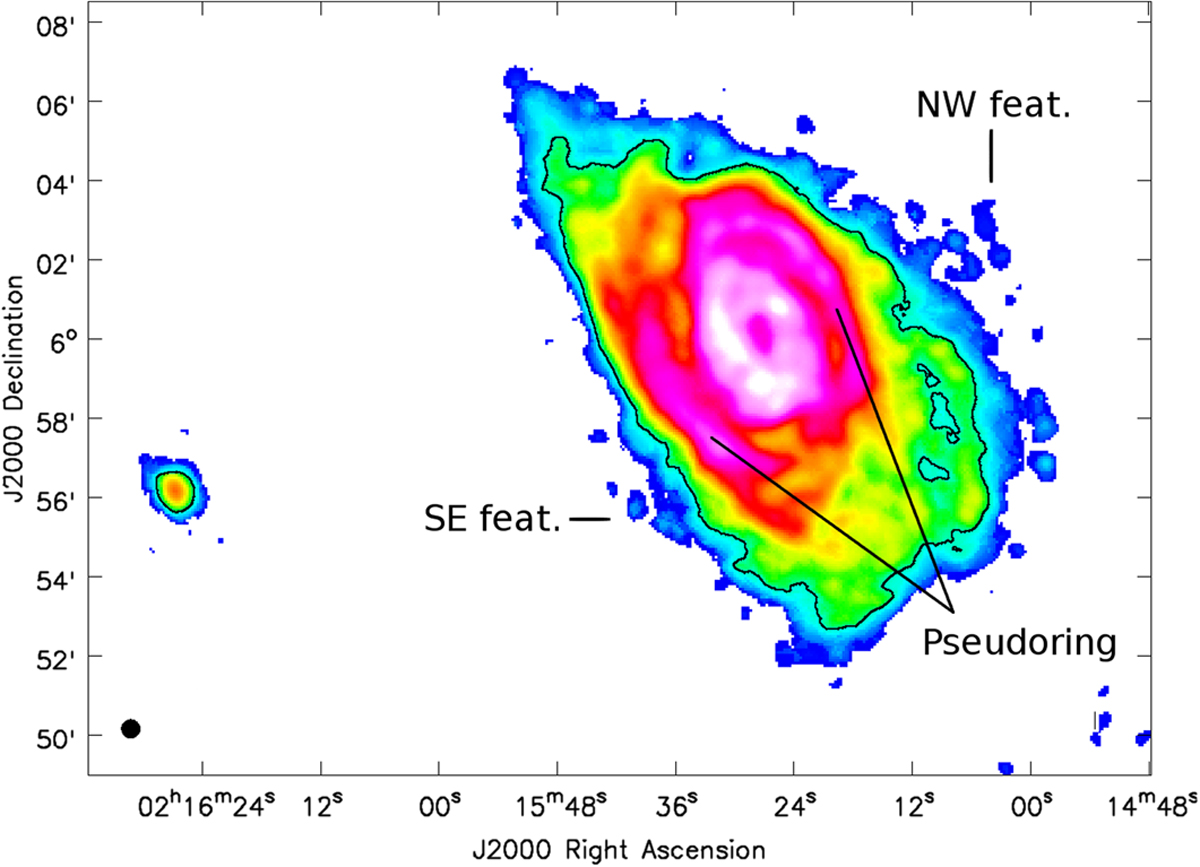
HI integrated intensity map of CIG 96 and its companion after a 3.5σ blanking (see Sect. 2.3). We identify the NW and SE HI features mentioned in Sect. 3.2 as well as the HI emission of the pseudo-ring. The black contour represents the column density of NHI = 8.7 × 1020 cm−2 (5σ) reached by Espada et al. (2011a). The black circle at the bottom left represents the beam size of 28″ × 28″.
Current usage metrics show cumulative count of Article Views (full-text article views including HTML views, PDF and ePub downloads, according to the available data) and Abstracts Views on Vision4Press platform.
Data correspond to usage on the plateform after 2015. The current usage metrics is available 48-96 hours after online publication and is updated daily on week days.
Initial download of the metrics may take a while.