Fig. 13.
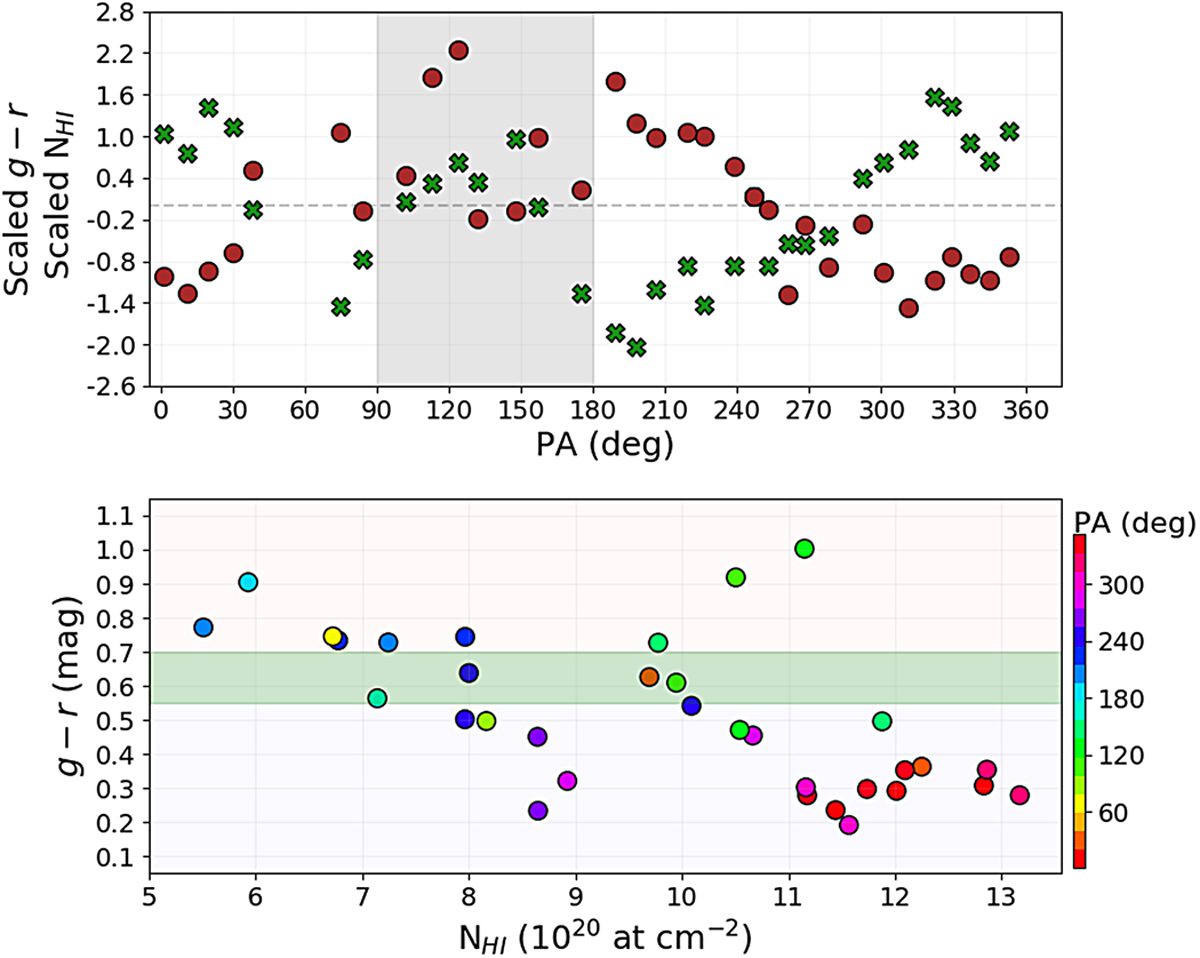
Top panel: g - r (brown circles) and NHI (green crosses) scaled (mean subtracted, sigma divided) values in each of the 33 apertures. A grey dashed line has been drawn at g − r = 0 for reference. Redder colours and higher NHI are positive in this figure. Bottom panel: g - r median colour index vs. NHI measured in the 33 apertures traced over the pseudo-ring. The green horizontal stripe represents the Green Valley in SDSS g - r.
Current usage metrics show cumulative count of Article Views (full-text article views including HTML views, PDF and ePub downloads, according to the available data) and Abstracts Views on Vision4Press platform.
Data correspond to usage on the plateform after 2015. The current usage metrics is available 48-96 hours after online publication and is updated daily on week days.
Initial download of the metrics may take a while.