Fig. 12.
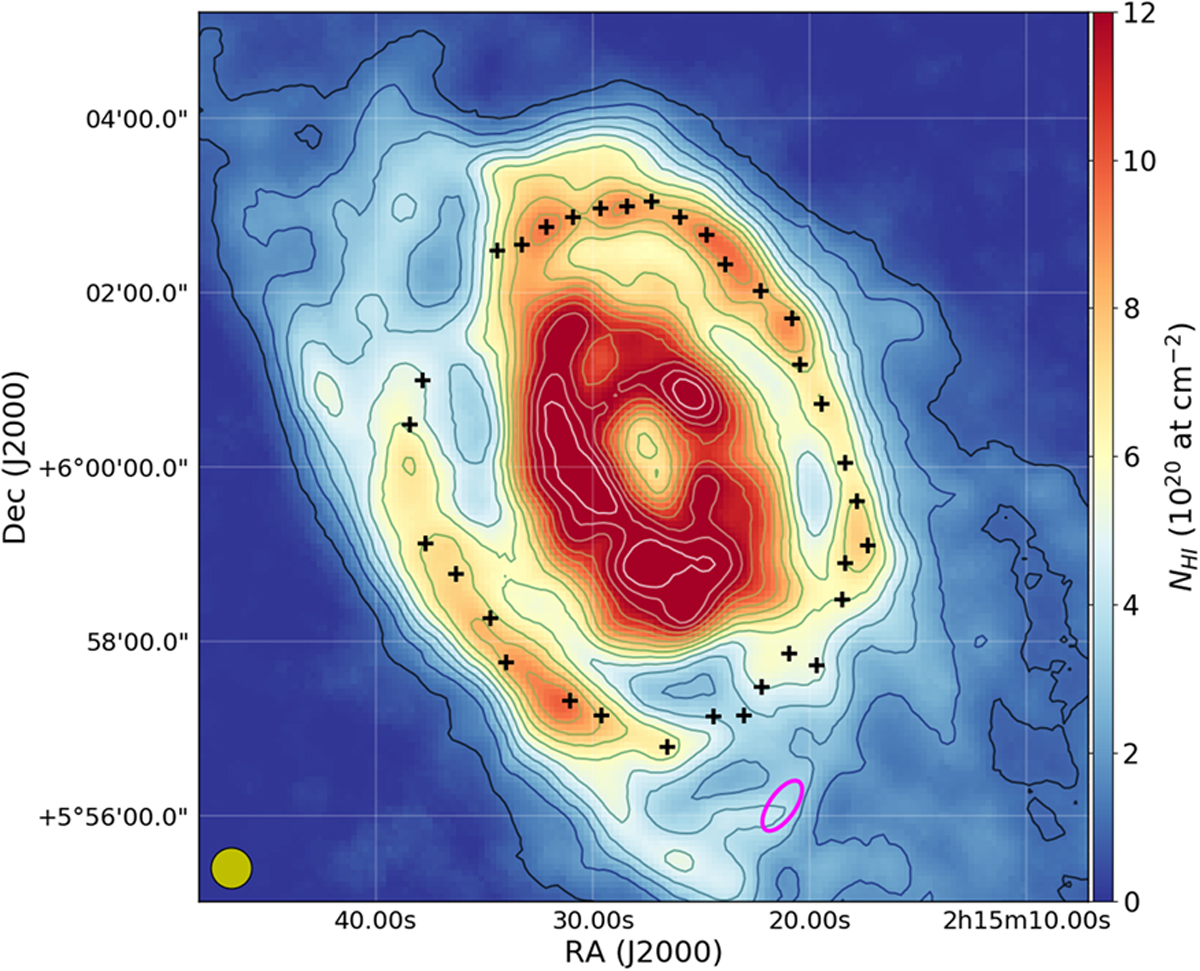
Central 53 × 53 kpc (9 × 9 arcmin) of the integrated HI emission map of CIG 96. Column density is indicated with a colour gradient. Contours indicate 1, 2, 3, 4, 5, 6, 7, 8, 9, 10, 11, 12, 13 and 14 × 1020 at cm−2. The black crosses indicate the central position of the 33 apertures used to measure the colours of the pseudo-ring (see Sect. 4.3.1). The magenta ellipse indicates the position of the southern feature indicated with a cyan arrow in Fig. 9, left panel, the g - r colour index image. The yellow circle at the bottom left indicates the HI image synthesized beam of 28″ × 28″.
Current usage metrics show cumulative count of Article Views (full-text article views including HTML views, PDF and ePub downloads, according to the available data) and Abstracts Views on Vision4Press platform.
Data correspond to usage on the plateform after 2015. The current usage metrics is available 48-96 hours after online publication and is updated daily on week days.
Initial download of the metrics may take a while.