Fig. 11.
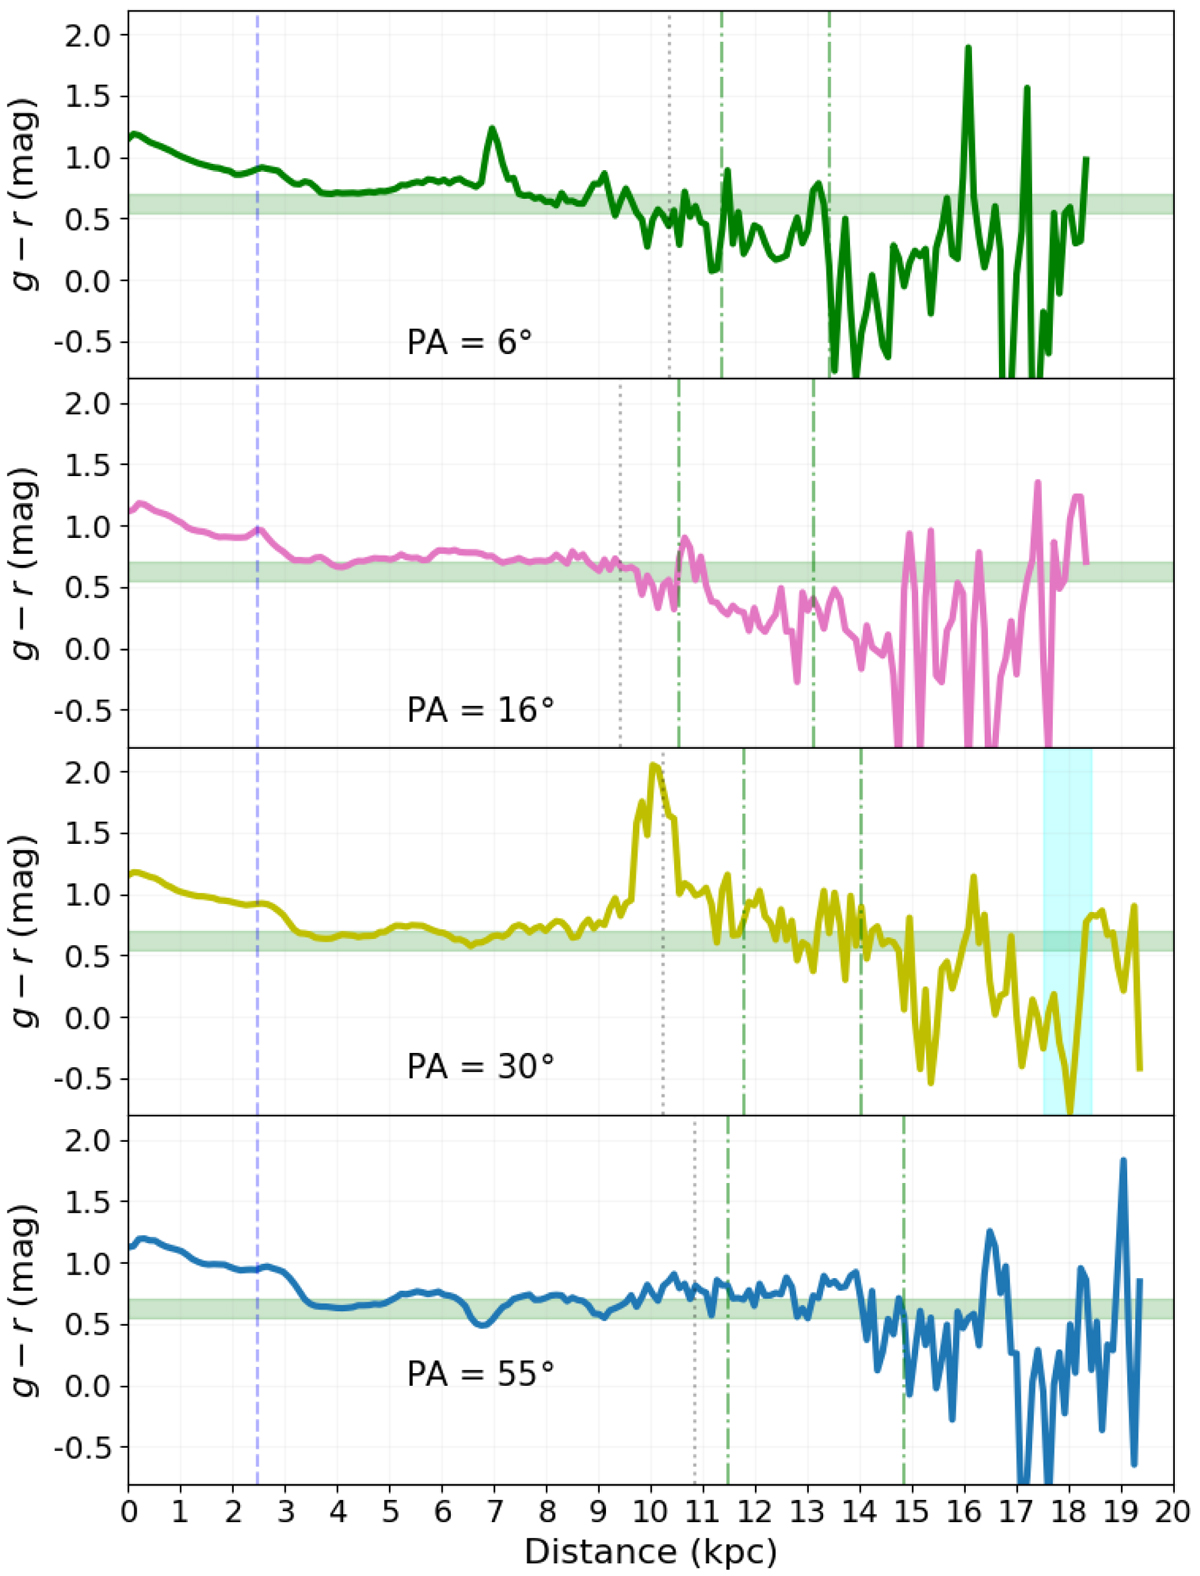
Radial profiles obtained along four different orientations with PA of 6°, 16°, 30° and 55° (shown in Fig. 9, right panel) at the top, top-centre, bottom-centre and bottom panels, respectively. The horizontal green stripe represents the Green Valley in SDSS g - r (see Sect. 4.3. The bulge, disc and pseudo-ring limits are measured at 26.8 mag arcsec−2. The bulge limit (2.5 kpc) and the disc limit are shown as the light blue dashed and black dotted lines, respectively. The pseudo-ring variable inner and outer limits are defined in each panel by the green dot-dashed lines. The light cyan band in the PA = 30° panel sets the location of the optical feature to the S marked as a cyan arrow in the left panel of Fig. 9 and a magenta ellipse in Fig. 13.
Current usage metrics show cumulative count of Article Views (full-text article views including HTML views, PDF and ePub downloads, according to the available data) and Abstracts Views on Vision4Press platform.
Data correspond to usage on the plateform after 2015. The current usage metrics is available 48-96 hours after online publication and is updated daily on week days.
Initial download of the metrics may take a while.