Fig. 10.
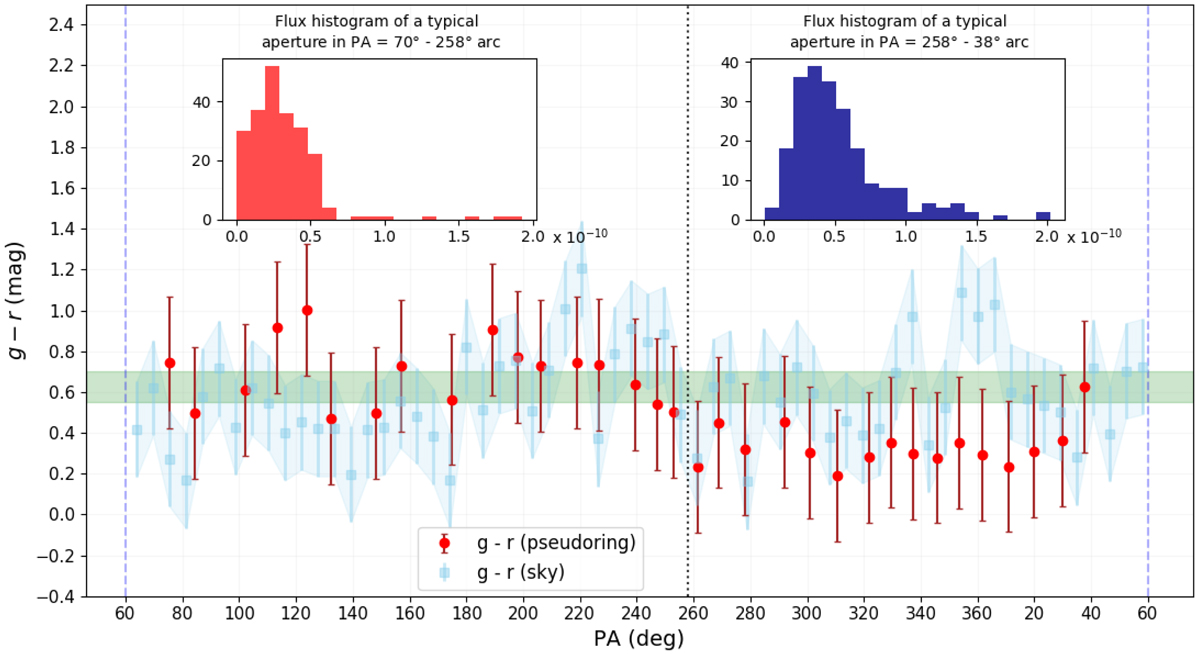
SDSS g - r colour index vs. PA along the pseudo-ring. The red dots represent the g - r values obtained from the de-projected images. They are obtained by dividing g median flux to the corresponding r median flux of each aperture and converting these results to magnitudes. The pale blue dots correspond to the g - r colour index measured at a distance of r = 29.5 kpc (∼5′) on the sky. The green stripe sets the Green Valley interval that separates the red cloud (g − r > 0.75 mag) from the blue cloud (g − r < 0.60 mag) as defined in 4.3. The embedded figures correspond to typical flux × 10−10 histograms for two apertures from the SE region (PA = 70° − 258°, left panel) and the NW region (PA = 258° − 38°, right panel) separated by the vertical doted grey line.
Current usage metrics show cumulative count of Article Views (full-text article views including HTML views, PDF and ePub downloads, according to the available data) and Abstracts Views on Vision4Press platform.
Data correspond to usage on the plateform after 2015. The current usage metrics is available 48-96 hours after online publication and is updated daily on week days.
Initial download of the metrics may take a while.