Fig. 6
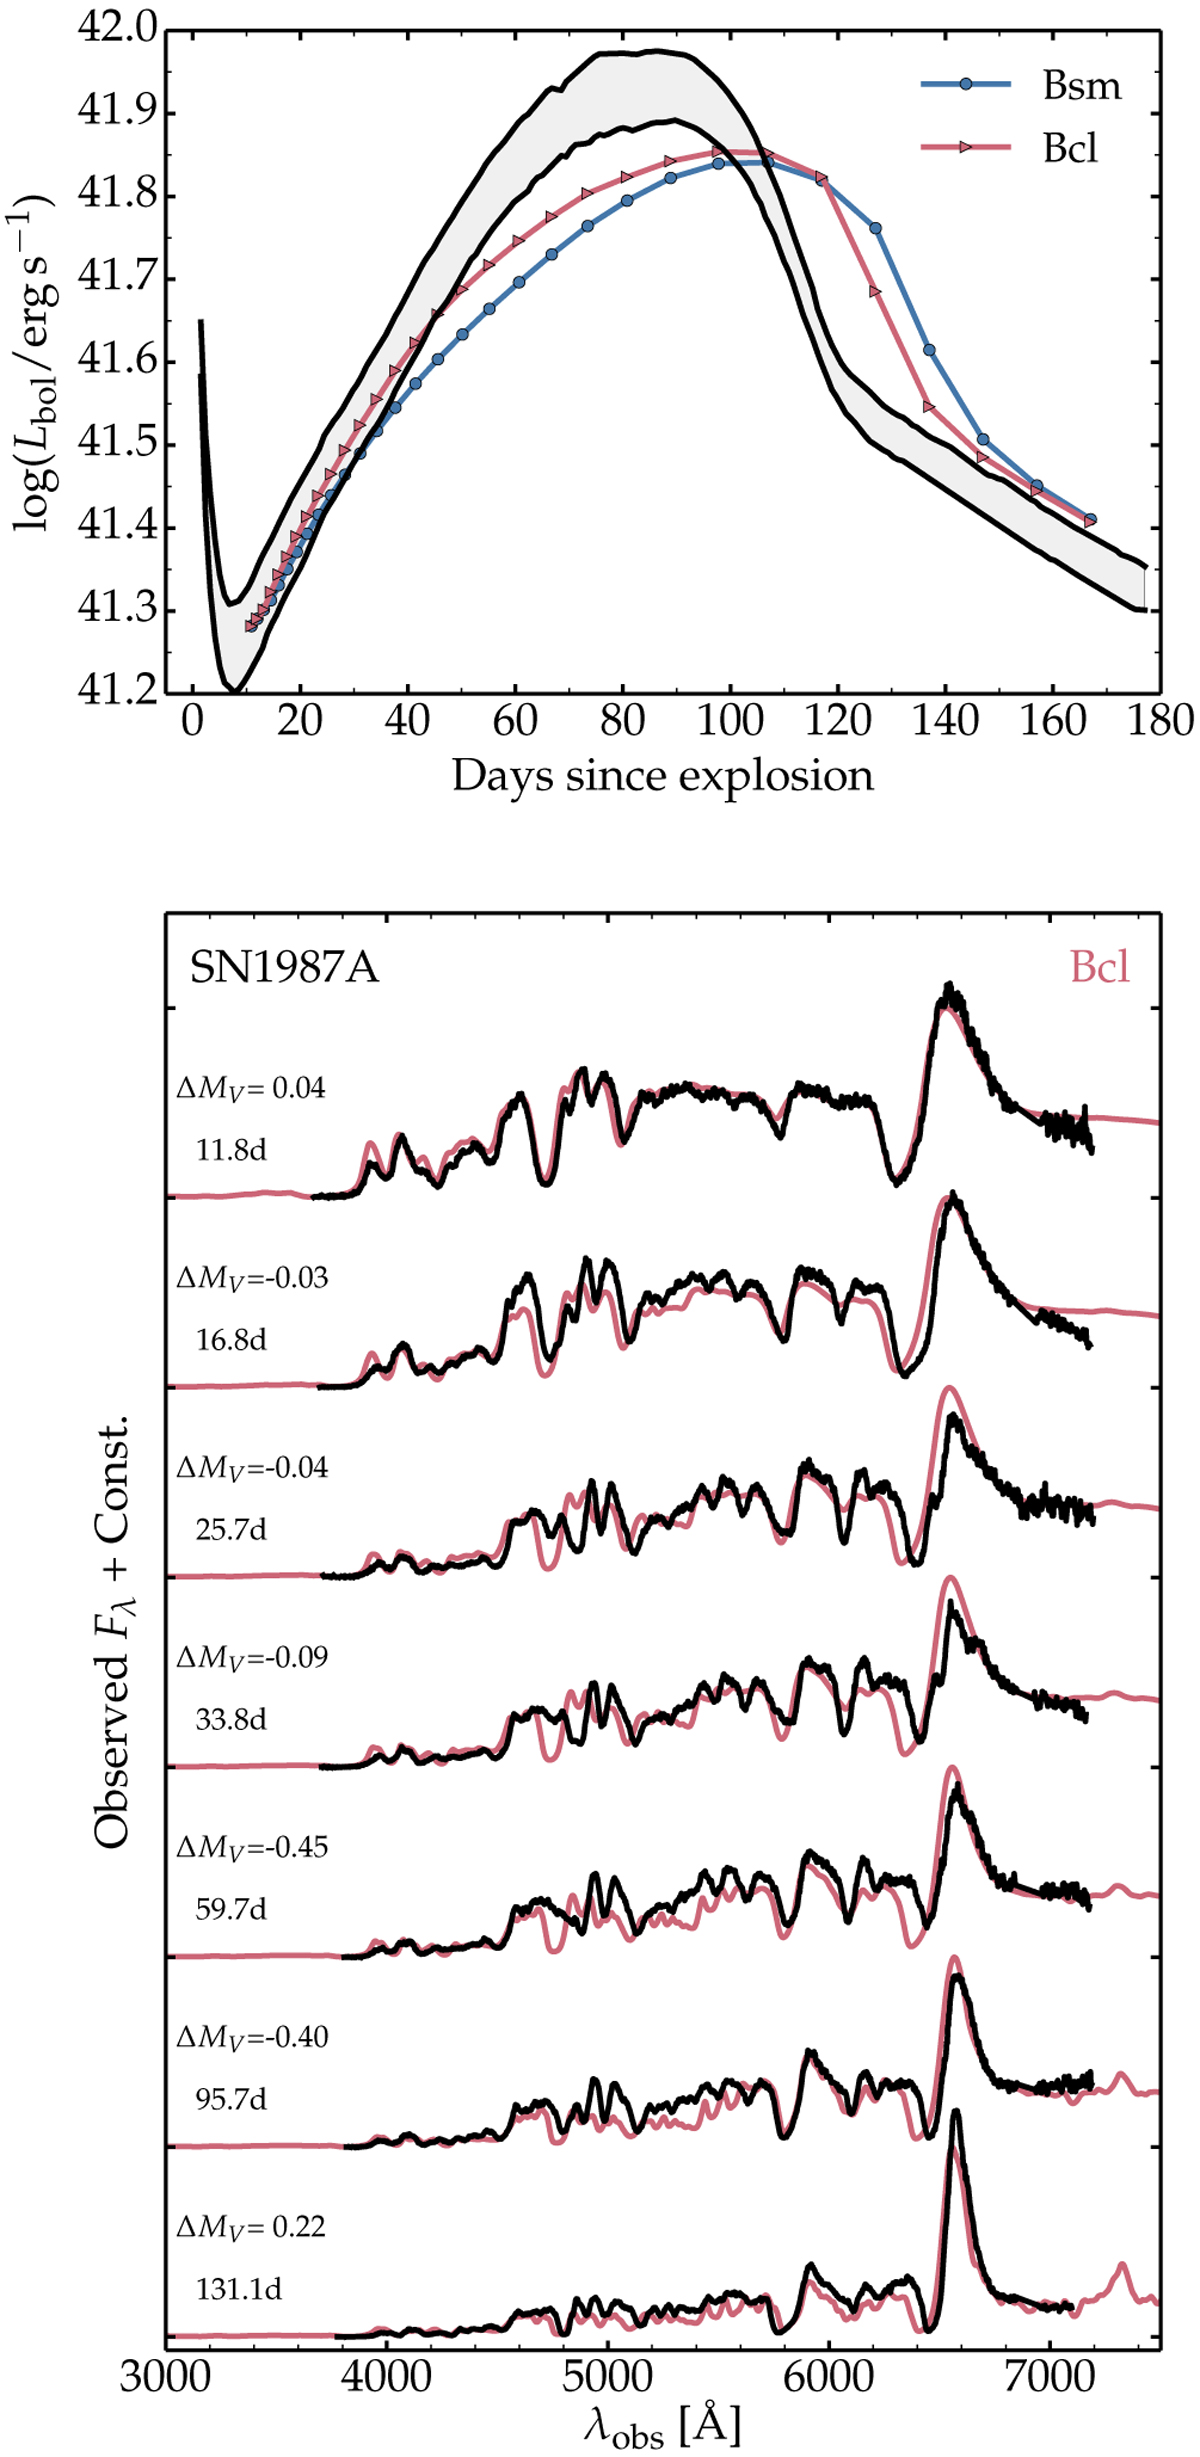
Comparison of the bolometric light curve (top panel: the shaded area is bounded by the bolometric light curves inferred by Catchpole et al. 1987 and Hamuy et al. 1988) and multi-epoch spectra for SN 1987A and our BSG explosion model Bcl (redshifted and reddened). The label gives the post-explosion epoch and the V -band magnitude offset between model Bcl and SN 1987A.
Current usage metrics show cumulative count of Article Views (full-text article views including HTML views, PDF and ePub downloads, according to the available data) and Abstracts Views on Vision4Press platform.
Data correspond to usage on the plateform after 2015. The current usage metrics is available 48-96 hours after online publication and is updated daily on week days.
Initial download of the metrics may take a while.