| Issue |
A&A
Volume 619, November 2018
|
|
|---|---|---|
| Article Number | A34 | |
| Number of page(s) | 6 | |
| Section | The Sun | |
| DOI | https://doi.org/10.1051/0004-6361/201833237 | |
| Published online | 06 November 2018 | |
Very narrow coronal mass ejections producing solar energetic particles
1 Astronomical Observatory of JU, Orla 171, Krakow, Poland
e-mail: This email address is being protected from spambots. You need JavaScript enabled to view it.
2 Sydney Institute for Astronomy, School of Physics, University of Sydney, NSW 2006, Australia
3 NASA Goddard Space Flight Center, Greenbelt, USA
Received:
15
April
2018
Accepted:
1
July
2018
Abstract
Aims. Our main aim is to study the relationship between low-energy solar particles (energies below 1 MeV) and very narrow coronal mass ejections (“jets” with angular width ≤ 20°).
Methods. For this purpose, we considered 125 very narrow coronal mass ejections (CMEs) from 1999 to 2003 that are potentially associated with low-energy solar particles (LESPs). These events were chosen on the basis of their source location. We studied only very narrow CMEs at the western limb, which are expected to have good magnetic connectivity with Earth.
Results. We found 24 very narrow CMEs associated with energetic particles such as ions (protons and 3He), electrons, or both. We show that arrival times at Earth of energetic particles are consistent with onset times of the respective CMEs, and that in the same time intervals, there are no other potential sources of energetic particles. We also demonstrate statistical differences for the angular width distributions using the Kolmogorov–Smirnov test for angular widths for these 24 events. We consider a coherent sample of jets (mostly originating from boundaries of coronal holes) to identify properties of events that produce solar energetic particles (velocities, widths, and position angles). Our study presents a new approach and result: very narrow CMEs can generate low-energy particles in the vicinity of Earth without other activity on the Sun. The results could be very useful for space weather forecasting.
Key words: Sun: coronal mass ejections (CMEs) / Sun: activity / Sun: particle emission
© ESO 2018
1. Introduction
The first coronal mass ejection (CMEs) was detected in the 1970s with the Orbiting Solar Observatory (Tousey 1973). CMEs are episodic large expulsions of magnetized plasma from the Sun that involve significant disturbances in the solar wind, and if they are directed toward Earth, can be potential sources of geomagnetic activity and harmful to advanced technology. Energetic CMEs can generate geomagnetic storms and solar energetic particles (SEPs; Gopalswamy et al. 2007). Understanding the mechanism by which SEPs are accelerated is a long-standing problem in solar physics (Cliver 2009). There is evidence for particle acceleration by two different processes: a flare reconnection process, and a CME-driven shock. Large SEP events are usually but not always associated with large flares and CME-driven shocks (Gopalswamy et al. 2015). Flare and shock processes both contribute to the particle flux, but the relative contribution from them is unclear (Cliver 2009; Klecker et al. 2007)
The timescales for CME eruptions are from several minutes to several hours (Hundhausen et al. 1994). A wide diversity of expulsions are observed, but the events may be divided into at least two categories: normal and narrow CMEs. The normal CMEs mostly originate from closed magnetic structures such as erupting flux rope systems, consisting typically of a three-part structure: a leading front, a dark cavity, and a bright core (Crifo et al. 1983).
The first narrow structures were detected in 1985 (Howard et al. 1985). Very narrow CMEs are defined as events whose angular width is 20° or less. This choice of an apparent angular width is quite arbitrary: the real difference between the types is that the very narrow CMEs have an elongated jet-like shape, whereas the normal CMEs resemble closed loops. These differences may indicate different mechanisms of initiation of the two CME types. The CME width distribution appears to be a featureless power law (Robbrecht et al. 2009), which suggests that there is only one basic mechanism.
Observations made with the Solar and Heliospheric Observatory (SOHO) mission’s Large Angle and Spectrometric Coronagraphs (LASCO) suggest that very narrow events themselves originate from either coronal holes (jet-like CMEs) or streamers (blob-like CMEs). The blob-like CMEs can be divided into two groups: structured and unstructured. Faster (above 400 km s−1) and narrower jets (angular width less than 5°) usually originate from coronal holes (St. Cyr et al. 1997) although jets can sometimes be caused by other magnetic processes (Kahler et al. 2001) while continous slow (300 km s−1) outflows are observed from streamers, and these events are similar to the solar wind. A mechanism for blob ejection and plasma sheet formation has been proposed in which a stretched helmet-streamer loop reconnects with neighboring open field lines in the vicinity of the cusp (Wang et al. 1998).
Kahler et al. (2001) found an impulsive SEP event observed by the Wind spacecraft on 2000 May 1 that was associated with an impulsive flare and also with a narrow CME. This result assumed a flare is necessary to produce SEPs at 1 AU, and Kahler et al. (2001) did not provide detailed information (e.g., velocities, widths, and position angle) for the event. The 2000 May 1 CME event has a position angle (PA) of 323°, a width of 54°, and a velocity of 1360 km s−1 (Wang et al. 2012). The angular width is sufficiently wide to exclude this CME from our group of very narrow CME events, according to our definition. Nitta et al. (2006) investigated the solar origin of impulsive SEP events generated by flares. They also demonstrated that these events were associated with CMEs with a range of different widths. Wang et al. (2012) surveyed the statistical properties of a set of 1191 solar electron events observed by the WIND 3DP instrument over one solar cycle (1995 through 2005). For a subset of the events, they also surveyed the accompanying low-energy ion emissions, which are highly enriched in 3He. They started from solar electron events and examined the possible association with Geostationary Operational Environmental Satellite (GOES) SXR flares, CMEs, and type II and III radio bursts. This sample includes a set of narrow CMEs with some overlap with the events we consider here, but nine very narrow SEP events in our group of events are not listed by Wang et al. (2012). This may be attributed to the different selection methods.
In comparison to previous studies, we concentrate on very narrow CMEs (“jets”) to show that such events (without other activity on the Sun, i.e., without flares) are able to produce lowenergy solar particles (LESPs). It is possible that very narrow CMEs may be a source of low-energy SEPs because they are expected to be triggered in open magnetic structures, which may allow the energized particles to escape. During solar activity maximum, coronal holes migrate from the poles to the equator and may then generate very narrow CMEs (jets) that are magnetically connected to Earth. We excluded the solar minimum as a period useful to investigations because large and stable streamers appear at the solar equator during solar minimum. Such magnetic structures produce only “blobs” (narrow but very slow CMEs). Therefore, SEPs produced by jets from coronal holes can only be detected during solar maximum. We here study very narrow CMEs around the maximum of solar cycle 23 (1999–2003).
In comparison to previous investigations, in the first stage we consider a coherent sample of jets (mostly originating from the boundaries of coronal holes) to identify properties of events that produce SEPs (velocities, widths, and PAs). This is a new approach and scientific goal.
This paper is divided as follows. The data used for this study are described in Sect. 2. A data analysis is performed in Sect. 3. In Sect. 4 we present the results of our analysis, and the conclusions are discussed in Sect. 5.
2. Data
For our analysis we used two databases: LASCO images, and the time series from the Advanced Composition Explorer (ACE) particle detector. The data for our study were taken from the SOHO/LASCO CME catalog. The list of CMEs in the catalog is compiled using images from the LASCO coronographs on board SOHO1. In our study we concentrated on fast and narrow CMEs originating close to the solar equator on the west side. These narrow CMEs can produce SEPs recorded near Earth. From the period of time 1999–2003, we selected events for which the central PAs are between 255° and 285° (the central PA is defined as the mid-angle with respect to the two edges of the CME in the sky plane and is measured anticlockwise from the solar north pole), the angular widths are equal to or below 20°, and the speeds are above 400 km s−1. We considered only narrow CMEs originating from the western hemisphere close to the solar equator. The motivation is that these events are likely to have good magnetic connectivity with Earth and so can generate energetic particles that are likely to reach Earth (McCracken 1962). Figure 1 presents a typical example of a considered jet ejection. The left panel displays the image from the Soft X-ray Telescope (SXT) on board the Yohkoh satellite. On the right side we show the running-difference image from the LASCO C2 coronagraph. The Yohkoh/SXT image at 02:01 UT shows the X-ray jet with a flare brightening at the jet base. This eruption is observed in the later four images. This event has a width of 12° and a speed of 610 km s−1. Similar X-ray structures were also observed, in Yohkoh or Extreme ultraviolet Imaging Telescope (EIT) images, for other considered ejections.
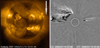 |
Fig. 1. Example of a jet ejection. Left panel: X-ray jet (Yohkoh/SXT) on 2000/07/10 at 02:01. Right panel: this jet is later observed in the LASCO C2 coronagraph at 03:00. |
The Electron, Proton, and Alpha Monitor (Gold et al. 1998; EPAM) on board the Advanced Composition Explorer (ACE) mission provides information about energetic particles appearing in the vicinity of Earth. ACE contains ten instruments, but only the EPAM detector is used for our study. It is important to note that the ACE satellite is placed outside of the Earth’s magnetosphere, so that it only registers particles from the interplanetary medium. We used the EPAM Level 2 Data, which show ions in five channels (46–67 keV, 115–193 keV, 315–580 keV, 795–1193 keV, and 1060–1880 keV) and electrons in four channels (between 38–53 keV, 53–103 keV, 103–175 keV, and 175–315 keV).
3. Data analysis
LESPs can be produced by different phenomena (e.g., flares and shocks). In the study we must be very careful to associate LESPs with narrow CMEs. For this purpose, for all considered CMEs, we applied the special procedure we describe below. We performed our study around the maximum of solar cycle 23 (1999–2003). As mentioned, the analysis was limited to fast (with speeds above 400 km s−1) and very narrow (a width of 20° or less) CMEs that were potentially magnetically connected to Earth (PAs between 255° and 285°). To ensure that a given ejection was really magnetically connected to the Earth, we inspected Yohkoh/SXT and SOHO/EIT images and searched for signatures of eruption from the limb of the solar disk. Additionally, we restricted the study to narrow events that are not a part of another CME. The selection criteria also include the requirement that there are no other west-limb CMEs in the LASCO images with times consistent with production of an SEP in the search-time window, or for some time before. This makes us confident that a given LESP event was not associated with a shock generated by another CME. For example, for the very narrow CME in our list that occurred on 2003 Jan 23 at 02:54, the ACE data show an increase in the 38–53 keV flux after ≈30 min, and an increase in the 175–315 keV flux after ≈15 min. This is consistent with the narrow CME at 02:54 producing the SEP event, and we do not observe other activity from the west limb in the four hours before. Hence we associate the narrow CME with the SEP event. Our study includes a very representative sample.
For the considered period of time, we found 125 events that fulfilled these requirements. If narrow CMEs orginating from the western hemisphere fulfil these conditions, they might be expected to produce an SEP event. To test this hypothesis using data from ACE, we searched for fluxes of energetic particles associated with our sample of narrow CMEs. To determine whether our narrow CMEs were associated with low-energy solar particles, we estimated their travel times to Earth. Energetic particles move along spiral magnetic field lines (the combination of the outward motion of the solar wind and solar rotation), so we assume that to reach Earth, they have to travel a distance equal to 1.2 AU. The solar wind blows radially outward, carrying with it the solar magnetic field, and it produces a classical Archimedean spiral magnetic field (the Parker spiral). The propagation distance 1.2 AU was calculated based on a slow solar wind speed of about 400 km s−1, which was assumed because the slow solar wind appears to originate from a region around the Sun’s equatorial belt (Feldman et al. 2005).
The travel time was estimated using the energy of the particles. We calculated travel times for ions (protons and 3He) and electrons observed by ACE in different energy ranges, using the relativistic formulas for protons and electrons. The estimates are presented in Table 1. The table shows the ranges of energies for respective detectors (Cols. 2 and 3), the respective travel times (Cols. 4, 5, and 6) and the differences between minimum and maximum travel times (Col. 7). For each channel the minimum travel time is calculated for the maximum energy, the maximum travel time is calculated for the minimum energy, and the median travel time is calculated for the median energy. For the five channels for ions and for the two channels for electrons, we obtained graphs from ACE data. Then, according to Table 1, we checked whether during the respective time frames the channels showed a visible increase in the flux above the noise level. To ensure that our methods were reliable, we required detection of LESPs in at least in two channels. It is important to mention that we assumed free-streaming propagation of the energetic particle. The SEPs along the way interact with interplanetary magnetic irregularities undergoing cross-field diffusion and changes in their kinetic energy (Dalla et al. 2013; Zank 2014).
Travel time for protons and electrons with energies covered by the ACE detectors.
Figure 2 shows the flux of electrons in the 38−53 keV and 53−103 keV energy ranges on 14 December 2001. From the time of observation of a narrow event at the Sun and using Table 1, we expect to see an increase in the electron flux after ≈20–30 min for these channels. The very narrow CME on 14 December 2001 occurred at 23:30. In the ACE data, a peak well above the noise at ≈00:00 on 2001 Dec 15 is visible, which is in the expected time window. The intensity level for the event is >2×103 cm−2 s−1 sr−1 MeV−1 in the 38−53 keV band and >2 × 102 cm−2 s−1 sr−1 MeV−1 in the 53−103 keV band.
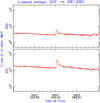 |
Fig. 2. Five-minute averaged solar particle flux. Electron flux in the ACE EPAM Level 2 data in the 38−53 keV and 53−103 keV energy ranges on 14 December 2001. |
4. Results
4.1. Events producing energetic particles
We found 24 LESPs that are associated with narrow CMEs. We considered only the very narrow events for which we observe an increase in the particle flux in at least two channels. These events are presented in Table 2. In the first three columns we present the number of the event, and the date and the time of CME appearance in the LASCO field of view. We have marked 15 events with asterisks that are also included in Wang et al. (2012). The next two columns give the onset time for the CME obtained from linear and quadratic fits to height-time points based on data in the SOHO/LASCO catalog. Parameters characterizing the CMEs (PA, angular width, and speed) are shown in Cols. 6, 7, and 8, respectively. Column 9 contains the location of the very narrow CMEs established on the basis of EIT images. We determined these locations using different ejection signatures. For events ejected behind the limb, the approximate longitudes are presented. Knowing the solar rotation rate, we estimated the longitudes of the active area that the respective CMEs are associated with. Column 10 provides the onset times of associated III type radio bursts in decameter-hectometer (DH, based on WIND data) and meter wavelengths (from the Solar Geophysical Data). In the case of two events, we did not identify any radio emissions. We also checked these databases for type II bursts. We found no type II radio bursts associated with these narrow events.
Properties of 24 very narrow CMEs generating low-energy SEPs.
Columns 11 and 12 give information about the types of particles that are generated by the events, that is, electrons and 3He–rich particles, respectively. The abundance of 3He was determined based on data from the Ultra Low Energy Isotope Spectrometer (ULEIS) particle instrument on board ACE. ULEIS measures ion fluxes from He through Ni from about 20 keV nucleon−1 to 10 MeV nucleon−1. It covers both suprathermal and energetic particle energy ranges. Additionally, we provide information about 3He–rich events obtained by Wang et al. (2012). Almost all SEP events are 3He rich. This indicates that reconnection produces the energetic particles (Nitta et al. 2015; Bucik et al. 2016). Only six extremely narrow events included in our studies were not 3He–rich events. In the last column, we show B0-angles representing the heliographic latitude of the central point of the solar disk. This angle varies from −7°.23 to +7°.23 and represents the inclination of the Sun’s equatorial plane with respect to the ecliptic. This parameter influences the magnetic connectivity of CMEs (Gopalswamy et al. 2013; Gopalswamy & Mäkelä 2014). When it is positive or negative for a north or south CME source location, it improves the magnetic connectivity. This parameter can be important in our study because we consider very narrow events. Only for three CMEs, taking into account source locations, is the magnetic connectivity weaker (4 December 2002, 15 August 2003, 3 October 2003). For the remaining events, this parameter improves the magnetic connectivity of the considered CMEs.
We assumed that a given particle flux is associated with a given CME if the particle travel time is consistent with the appearance times for the SEP event at Earth. Table 2 shows that only five CMEs generate fluxes of both electrons and ions at ACE. Sixteen CMEs produce only fluxes of electrons, and three events produce only energetic ions. One of the SEP events, on 4 October 2003, is associated with a flare at 13:09 (N06W91). In comparison to previous studies (e.g., Wang et al. 2012) our procedure is very restrictive. If we cannot observe an increase in particle flux well above the noise level, or if any case is uncertain, we mark “no” in Table 1.
To prove that associations between the narrow CMEs and SEPs are real, we conducted an additional test. We chose at random 30 narrow and isolated events with PAs excluding their magnetic connection to Earth. These events were not likely to produce SEPs near Earth. If in our study an accidental coincidence between SEPs and the very narrow CMEs was possible, we should also find energetic particles for these events. We did not find any SEPs associated with these CME events, however. This result clearly proves that our considerations are correct.
We checked different databases for X-ray flares associated with our events. Only two of the SEP events were associated with flares. The first occurred on 26 December 2002 at 14:38 (S14W91, B5.1), and the second occurred on 4 October 2003 at 13:09 (N06W91, C2.5).
We also evaluated CME speed profiles. The considered events are very fast and mostly reach high speeds (>600 km s−1) very close to the Sun (20 events). This velocity is enough to generate interplanetary shocks (Gopalswamy et al. 2001). For 4 events, which have only a few height-time points in the LASCO field of view, the velocity determination close to the Sun is ambiguous. Of the considered CMEs, 75% decelerate in the LASCO field of view.
The considered SEP events are mostly 3He–rich. This means that magnetic reconnection is involved in particle acceleration (Nitta et al. 2015). On the other hand, the associated CMEs attain high speed early and can produce shocks, although of very small width. Probably both these mechanisms, magnetic reconnection and shocks, must be effective to generate SEP events.
4.2. Statistical analysis of narrow CMEs
Only 19% (24) of the 125 narrow CME events we identified produced energetic particles. It is interesting to compare the properties of the narrow CMEs that do and that do not produce energetic particles. The CME samples are statistically different. All CMEs producing SEPs are limb events (longitude close to 90°) that were located very close to the solar equator. The CMEs without SEPs can be located much closer to the solar center: about 20% of them have a longitude lower than or equal to 70°. The presence of type III radio bursts is an indicator of energetic electrons in the solar corona. For 21 (90%) SEPs events we found associated type III bursts. In Fig. 2 we show the velocity distributions of CMEs that produce (dashed line) and that do not produce SEPs (solid line). The diagrams suggest that the SEP events are associated with fast narrow CMEs. The narrow CMEs with SEPs have a median speed that is 100 km s−1 faster than narrow CMEs without associated SEPs.
The second most important parameter characterizing CMEs is their angular width. In Fig. 3 we show the angular width distribution of CMEs that produce SEPs (dashed line) and that do not produce SEPs (solid line). The diagrams suggest that SEP events are more likely to be produced from slightly wider CMEs. It is important to note that energetic particles are observed to be generated by CMEs with an angular width larger than or equal to 6°.
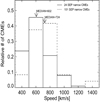 |
Fig. 3. Velocity distribution for narrow CMEs associated with SEPs (dashed line) and without SEPs (solid line). |
To estimate the probability that the two sets of data (narrow CMEs with SEPs, and narrow CMEs without SEPs) are drawn from the same distribution, we performed a Kolmogorov-Smirnov (K–S) test (Press et al. 1992) on the distributions shown in Figs. 3 and 4. For the speed distributions (Fig. 4), the K–S test result is p = 0.3 (p is the computed probability at the 0.05 significance level), and for the width distributions (Fig. 3), the result is p = 0.01. Hence there is no evidence for a statistical difference between the velocity distributions, but there is evidence for a difference between the width distributions.
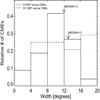 |
Fig. 4. Angular width distribution for narrow CMEs associated with SEPs (dashed line) and without SEPs (solid line). |
Finally, in Fig. 5 we consider PA distributions for the two CME samples. This parameter is very important because to be geoeffective, narrow CMEs must originate close to the solar equator. The distributions are very similar. The narrow SEP events have PAs between 255 and 290°. If CMEs are really associated with SEP events, they must be magnetically connected to Earth. This means than the narrowest events producing SEPs should exactly originate in the regions closest to the solar equator. In Fig. 5 we present PA distributions, but only for CMEs with an angular width smaller than 8°. The CMEs producing SEPs originate only from PAs between 261° and 279°, but CMEs without SEPs originate from significantly wider ranges of PAs (249°–285°). This means that the PAs of CMEs producing SEPs are correlated with their widths (with a correlation coefficient equal to 0.33). The correlation coefficient is not significant, but we recall that wider CMEs (width ≥ 8°) producing SEPs can originate from the entire range of PAs, but only the narrowest events are limited to start exactly from the equatorial region.
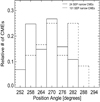 |
Fig. 5. PA distribution for narrow CMEs associated with SEPs (dashed line) and without SEPs (solid line). |
5. Summary and discussion
We considered the possibility that LESPs might be produced by very narrow CMEs. For this purpose, we investigated narrow CMEs around the maximum of solar cycle 23 with PAs between 245° and 295°, corresponding to CMEs that are more likely to produce SEPs that are able to reach Earth. Using data from the EPAM instrument on board the ACE satellite, we found 24 (19% of all the considered events) low-energy solar particle fluxes that we associated with narrow CME events. The association between very narrow CMEs and energetic particles was based on the consistency between estimates for particle travel times from the Sun and the appearance times for the SEP events at Earth. To ensure that these associations are real, we considered only isolated narrow CMEs without any additional energetic phenomena on the Sun. To ensure that associations between the narrow CMEs and SEPs are real, we conducted an additional test. We chose at random 30 narrow and isolated events with PAs that excluded a magnetic connection to Earth. These events were not likely to produce SEPs near Earth. If in our study an accidental coincidence between SEPs and the very narrow CME appeared, we should also find energetic particles for these events. We did not find any SEPs associated with these CME events, however. This result clearly demonstrates that our considerations are correct.
Additionally, we performed a statistical analysis of the narrow CMEs. We separately considered the narrow CMEs associated with energetic particles and those without energetic particles. We demonstrated a statistical difference for the angular width of the SEP-related events in comparison to the other narrow events. This suggests that these events constitute a separate group of very narrow CMEs that are sufficiently powerful to produce energetic particles that can be detected at Earth. We demonstrated that the velocity distributions for CMEs without SEPs that are associated with SEPs are very similar. However, the latter are on average about 100 km s−1 faster than CMEs without associated SEPs. Additionally, we showed that CMEs producing SEPs show a correlation between their PAs and widths.
We demonstrated that narrow CMEs can generate energetic particles in the vicinity of Earth. This new result may be important for space weather forecasting. Admittedly, low-energy particles are less dangerous for astronauts, but they are harmful for satellites. Our study presents a new approach and set of results, and confirms that very narrow CMEs can generate low-energy particles without other activity on the Sun.
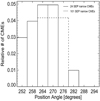 |
Fig. 6. PA distribution for narrow CMEs associated with SEPs (dashed line) and without SEPs (solid line). Only CMEs with an angular width smaller than 8° are shown. |
Acknowledgments
Katarzyna Bronarska was supported by NCN through grant UMO-2013/09/B/ST9/00034, and Grzegorz Michalek was supported by NCN through grant UMO-2017/25/B/ST9/00536.
References
- Bucik, R., Innes, D. E., Mason, G. M., & Wiedenbeck, M. E. 2016, ApJ, 833, 13 [Google Scholar]
- Cliver, E. W. 2009, IAU Symp., 257, 401 [NASA ADS] [Google Scholar]
- Crifo, F., Picat, J. P., & Cailloux, M. 1983, Sol. Phys., 83, 143 [NASA ADS] [CrossRef] [Google Scholar]
- Dalla, S., Marsh, M. S., Kelly, J., & Laitinen, T. 2013, J. Geophys. Res., 118, 5979 [NASA ADS] [CrossRef] [Google Scholar]
- Feldman, U., Landi, E., & Schwadron, N. A. 2005, J. Geophys. Res., 110, A07109 [Google Scholar]
- Gold, R. E., Krimigis, S. M., Hawkins, E., III, et al. 1998, Space Sci. Rev., 86, 541 [Google Scholar]
- Gopalswamy, N., & Mäkelä, P. 2014, ASP Conf. Ser., 484, 63 [NASA ADS] [Google Scholar]
- Gopalswamy, N., St Cyr, O. C., Kaiser, M. L., & Yashiro, S. 2001, Sol. Phys., 203, 149 [NASA ADS] [CrossRef] [Google Scholar]
- Gopalswamy, N., Yashiro, S., & Akiyama, S. 2007, J. Geophys. Res., 112, 6112 [CrossRef] [Google Scholar]
- Gopalswamy, N., Xie, H., Akiyama, S., et al. 2013, ApJ, 765, L30 [NASA ADS] [CrossRef] [Google Scholar]
- Gopalswamy, N., Mâkela, P., Akiyama, et al. 2015, ApJ, 806, 8 [Google Scholar]
- Howard, R. A., Sheeley, N. R., Jr., Miche, D. J., & Koomen, M. J. 1985, J. Geophys. Res., 90, 8173 [Google Scholar]
- Hundhausen, A. J., Burkepile, J. T., & St Cyr, O. C. 1994, Geophys. Res., 99, 6543 [NASA ADS] [CrossRef] [Google Scholar]
- Kahler, S. W., Reames, D. V., & Sheeley, N. R., Jr. 2001, ApJ, 562, 558 [NASA ADS] [CrossRef] [Google Scholar]
- Klecker, B., Mbius, E., & Popecki, M. A. 2007, Space Sci. Rev., 130, 273 [NASA ADS] [CrossRef] [Google Scholar]
- McCracken, K. G. 1962, J. Geophys. Res., 67, 447 [NASA ADS] [CrossRef] [Google Scholar]
- Nitta, N. V., Reames, D. V., De Rosa, M. L., et al. 2006, ApJ, 650, 438 [Google Scholar]
- Nitta, N. V., Mason, G. M., Wang, L., Cohen, C. M. S., & Wiedenbeck, M. E. 2015, ApJ, 806, 235 [NASA ADS] [CrossRef] [Google Scholar]
- Press, W. H., Teukolsky, S. A., Vetterling, W. T., & Flannery, B. P. 1992, Numerical recipes in C, 2nd edn. (Cambridge: University Press) [Google Scholar]
- Robbrecht, E., Berghmans, D., & Van der Linden, R. A. M. 2009, ApJ, 691, 1222 [NASA ADS] [CrossRef] [Google Scholar]
- St Cyr, O. C., Howard, R.A., Simnett, G.M., et al. 1997, ESA SP, 415, 103 [NASA ADS] [Google Scholar]
- Tousey, R. 1973, Space Res. XIII, 2, 713 [Google Scholar]
- Wang, Y.-M., Sheeley, N. R., Jr., Socker, D. G., et al. 1998, ApJ, 508, 899 [NASA ADS] [CrossRef] [Google Scholar]
- Wang, L., Lin, R. P., Krucker, K., & Mason, G. M. 2012, ApJ, 759, 12 [NASA ADS] [CrossRef] [Google Scholar]
- Zank, G. P. 2014, Lect. Notes Phys., 877 [Google Scholar]
All Tables
Travel time for protons and electrons with energies covered by the ACE detectors.
All Figures
|
Fig. 1. Example of a jet ejection. Left panel: X-ray jet (Yohkoh/SXT) on 2000/07/10 at 02:01. Right panel: this jet is later observed in the LASCO C2 coronagraph at 03:00. |
| In the text | |
|
Fig. 2. Five-minute averaged solar particle flux. Electron flux in the ACE EPAM Level 2 data in the 38−53 keV and 53−103 keV energy ranges on 14 December 2001. |
| In the text | |
|
Fig. 3. Velocity distribution for narrow CMEs associated with SEPs (dashed line) and without SEPs (solid line). |
| In the text | |
|
Fig. 4. Angular width distribution for narrow CMEs associated with SEPs (dashed line) and without SEPs (solid line). |
| In the text | |
|
Fig. 5. PA distribution for narrow CMEs associated with SEPs (dashed line) and without SEPs (solid line). |
| In the text | |
|
Fig. 6. PA distribution for narrow CMEs associated with SEPs (dashed line) and without SEPs (solid line). Only CMEs with an angular width smaller than 8° are shown. |
| In the text | |
Current usage metrics show cumulative count of Article Views (full-text article views including HTML views, PDF and ePub downloads, according to the available data) and Abstracts Views on Vision4Press platform.
Data correspond to usage on the plateform after 2015. The current usage metrics is available 48-96 hours after online publication and is updated daily on week days.
Initial download of the metrics may take a while.