Fig. 4
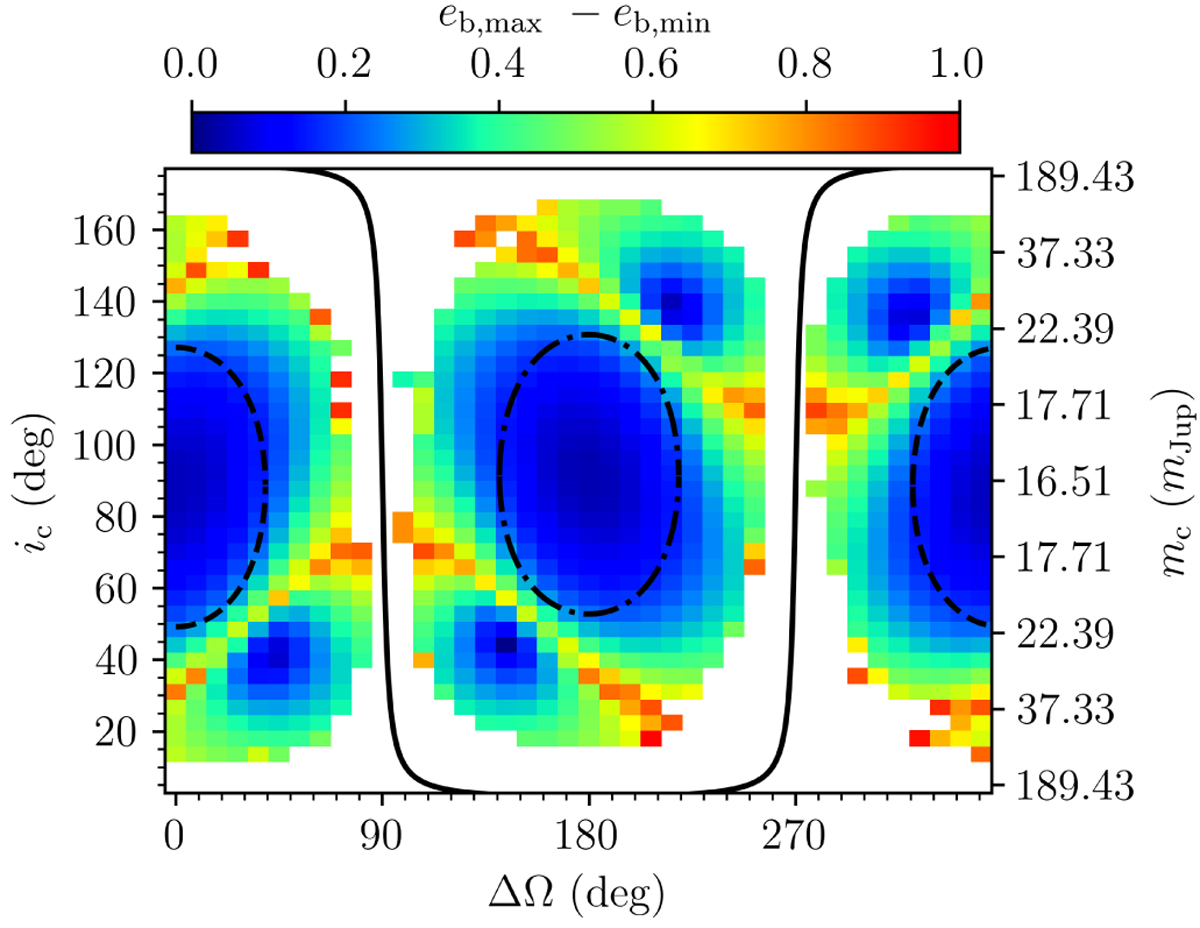
Difference between the maximum and minimum eccentricities of the inner planet over the whole simulation for each set (ic, Δ Ω). White squares represent aborted simulations (collision or ejection of one body). The black lines are isocurves of Im, the mutual inclination. The solid line corresponds to Im = 90°, the dashed line to Im = 39°, and the dash-dotted line to Im = 141°.
Current usage metrics show cumulative count of Article Views (full-text article views including HTML views, PDF and ePub downloads, according to the available data) and Abstracts Views on Vision4Press platform.
Data correspond to usage on the plateform after 2015. The current usage metrics is available 48-96 hours after online publication and is updated daily on week days.
Initial download of the metrics may take a while.