Free Access
Fig. 2.
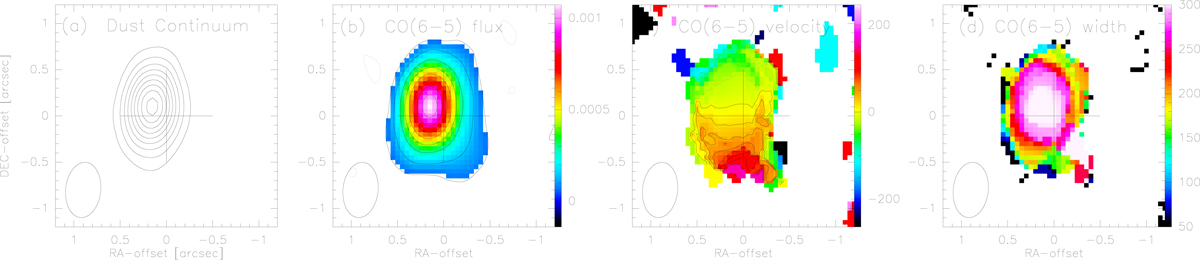
From left to right: dust continuum map of J2310+1855 (levels from 2 to 45σ by 5σ, σ = 5.36 μJy beam−1), moment 0, 1, 2 maps of the CO(6-5) emission line. Color-scale units are mJy and km s−1, respectively. The cross indicates the phase center. The synthesized beam is indicated in the lower-left part of the diagrams.
Current usage metrics show cumulative count of Article Views (full-text article views including HTML views, PDF and ePub downloads, according to the available data) and Abstracts Views on Vision4Press platform.
Data correspond to usage on the plateform after 2015. The current usage metrics is available 48-96 hours after online publication and is updated daily on week days.
Initial download of the metrics may take a while.