Fig. 1.
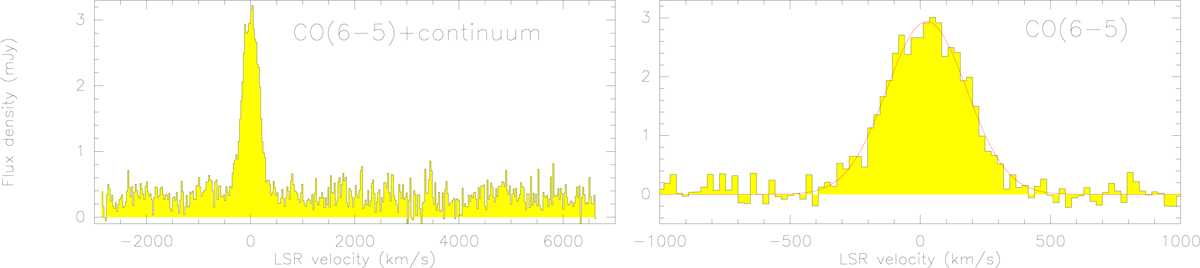
Left panel: spectrum of spectral windows 1 + 2, including the CO(6-5) emission line and the continuum emission, extracted from the region included within the ≥2σ in the velocity-integrated map. Right panel: zoom onto the continuum-subtracted CO(6-5) spectrum. The red line shows a fit with a Gaussian function. Spectra are plotted at the maximum spectral resolution of the data (23.7 km s−1).
Current usage metrics show cumulative count of Article Views (full-text article views including HTML views, PDF and ePub downloads, according to the available data) and Abstracts Views on Vision4Press platform.
Data correspond to usage on the plateform after 2015. The current usage metrics is available 48-96 hours after online publication and is updated daily on week days.
Initial download of the metrics may take a while.