Fig. 6.
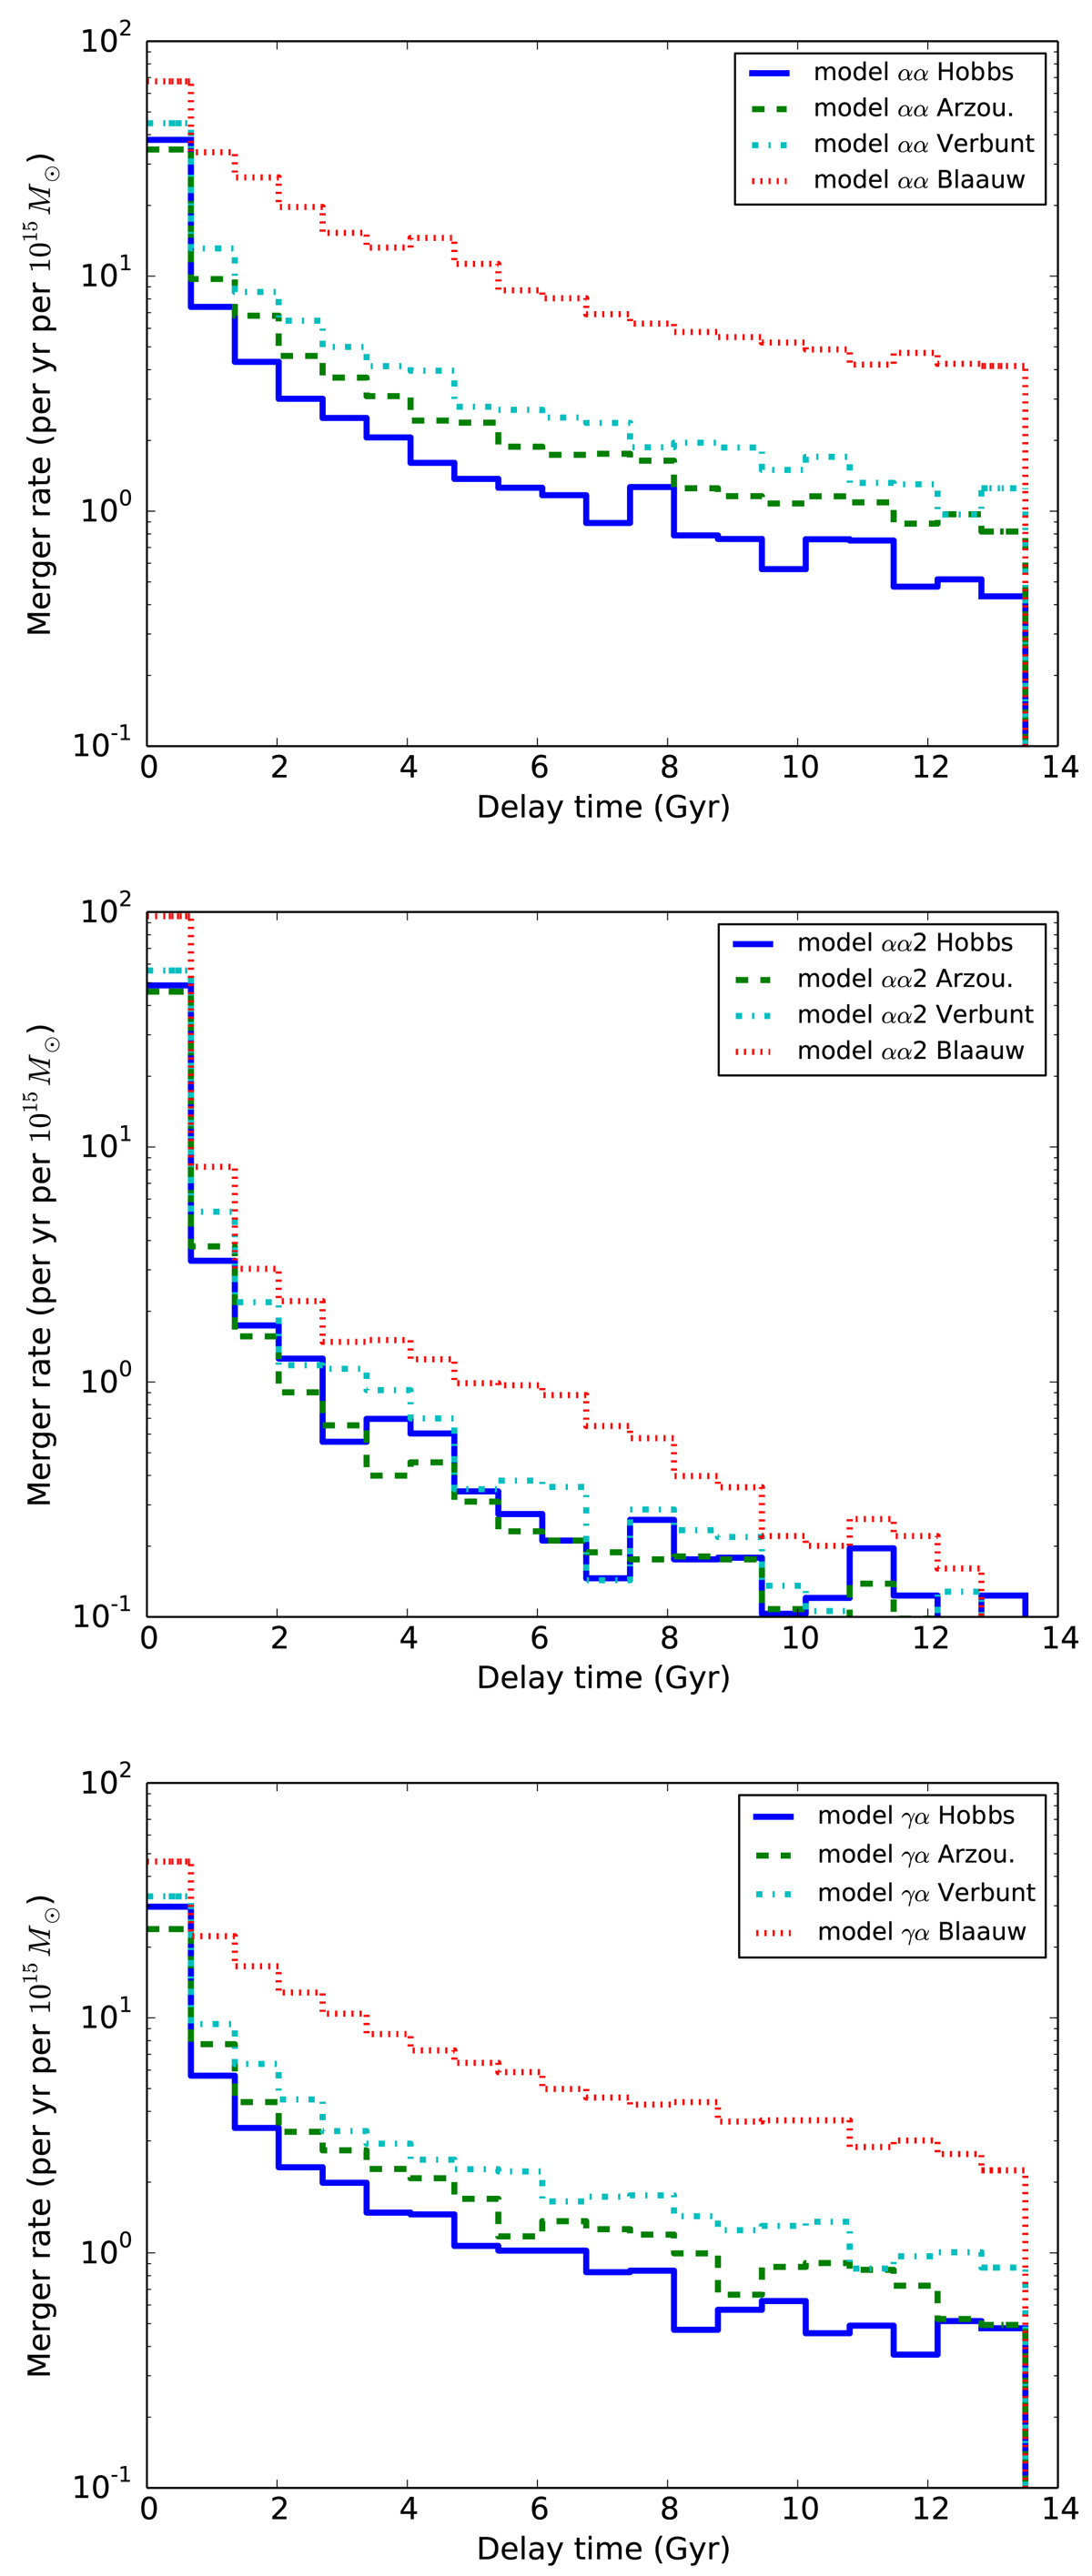
Effect of SN-kicks on the delay time distributions of NS–WD mergers for different CE models. The rate is minimized for the large SN kicks of the Hobbs-distribution (blue solid line) and the Arzoumanian-distribution (green dashed line). If the SN kick is only due to the instantaneous mass loss (Blaauw-kick, red dashed line), the rate is maximized. The different panels show the DTDs from different CE models; model αα on top, model αα2 in the middle, and model γα on the bottom. See also Fig. 5 for a direct comparison of the DTDs from the CE models.
Current usage metrics show cumulative count of Article Views (full-text article views including HTML views, PDF and ePub downloads, according to the available data) and Abstracts Views on Vision4Press platform.
Data correspond to usage on the plateform after 2015. The current usage metrics is available 48-96 hours after online publication and is updated daily on week days.
Initial download of the metrics may take a while.