Fig. 5.
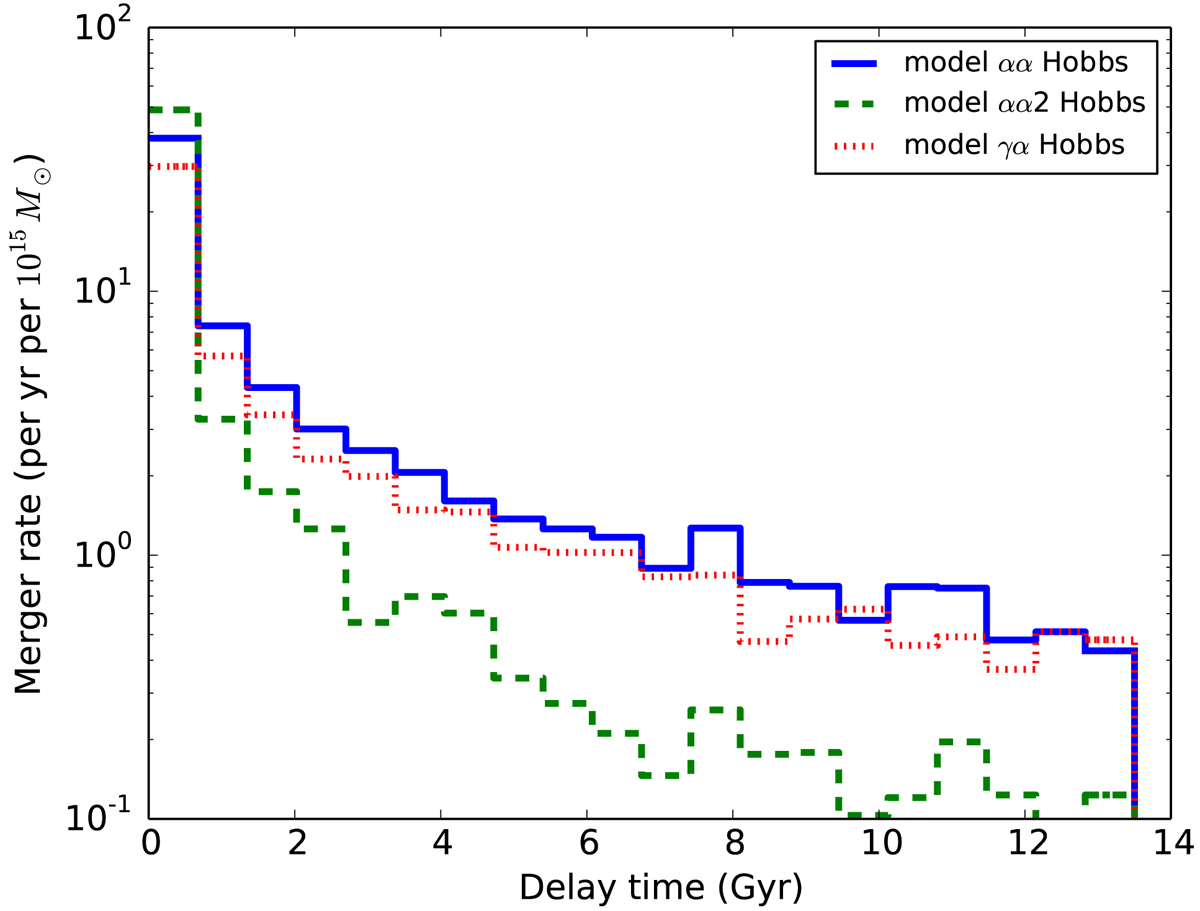
Effect of CE evolution on the delay-time distributions of NS–WD mergers. The figure shows DTDs for different models of the common-envelope phase with SN-kicks that follow the Hobbs distribution. The slope of the DTD is strongly dependent on the CE efficiency. Model αα (α-CE with αλ = 2, solid blue line) and model γα (γ-CE, dotted red line) give similar DTDs with tails extending to long delay times. Mergers at long delay times are suppressed in model αα2 (α-CE with αλ = 0.25, dashed green line).
Current usage metrics show cumulative count of Article Views (full-text article views including HTML views, PDF and ePub downloads, according to the available data) and Abstracts Views on Vision4Press platform.
Data correspond to usage on the plateform after 2015. The current usage metrics is available 48-96 hours after online publication and is updated daily on week days.
Initial download of the metrics may take a while.