Fig. 7
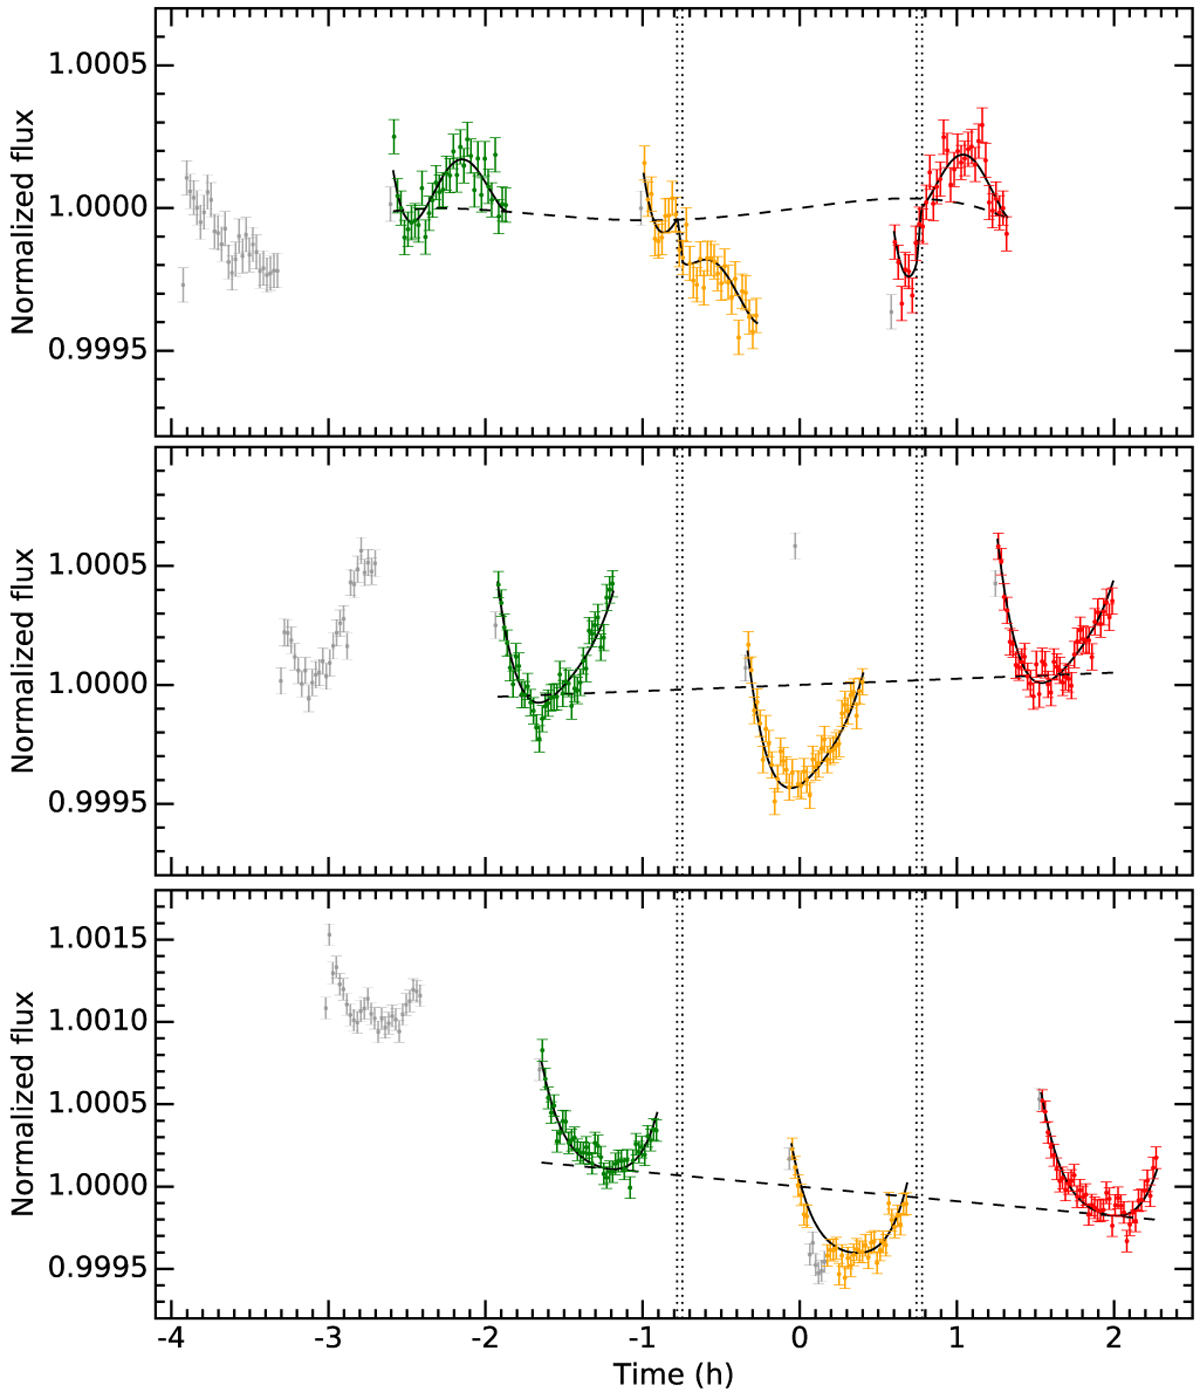
STISspectra of 55 Cnc integrated over the visible band, and plotted as a function of time relative to the transit of 55 Cnc e (vertical dotted lines show the beginning and end of ingress and egress of the transit). The solid black line is the best-fit model to the data, which includes the breathing and long-term flux variations, and the transit. The black dashed line is the model contribution to the long-term variations. Visit ASTIS, BSTIS, and CSTIS are plotted from top to bottom. The second, third, and fourth orbits in each visit are colored in green, orange, and red. Exposures excluded from the fit are plotted in gray.
Current usage metrics show cumulative count of Article Views (full-text article views including HTML views, PDF and ePub downloads, according to the available data) and Abstracts Views on Vision4Press platform.
Data correspond to usage on the plateform after 2015. The current usage metrics is available 48-96 hours after online publication and is updated daily on week days.
Initial download of the metrics may take a while.