Fig. 5
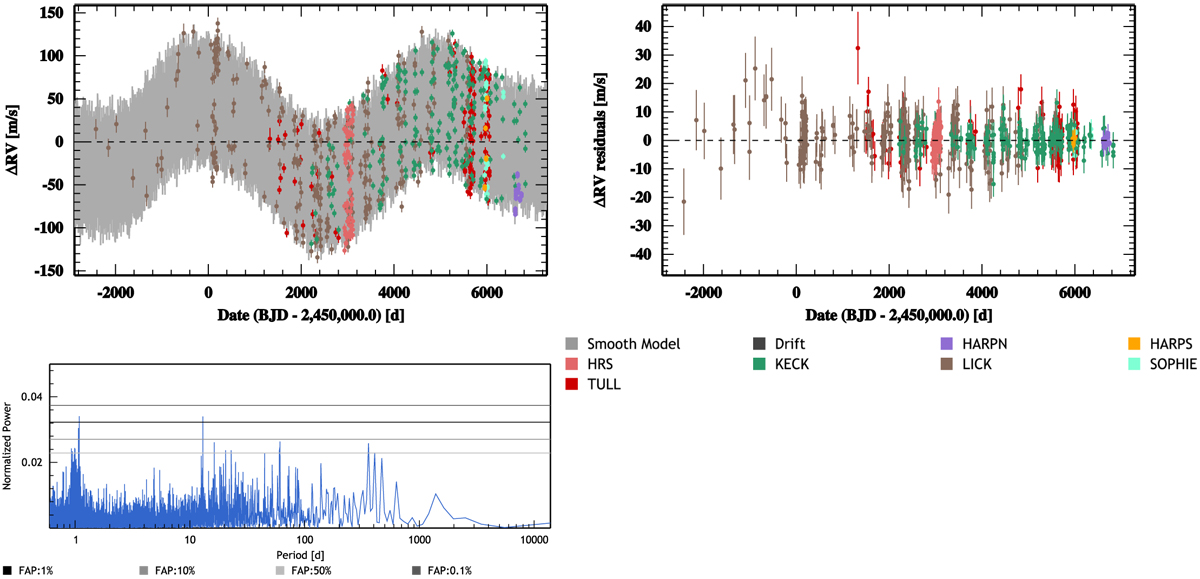
Top left panel: 1552 RV measurements binned over a timescale of 30 min with the best model overplotted. This model is obtained by taking the median of each marginalized posterior after our MCMC run. Top right panel: RV residuals after removing the best model. Bottom left panel: GLS periodogram of the RV residuals including false-alarm probability detection thresholds.
Current usage metrics show cumulative count of Article Views (full-text article views including HTML views, PDF and ePub downloads, according to the available data) and Abstracts Views on Vision4Press platform.
Data correspond to usage on the plateform after 2015. The current usage metrics is available 48-96 hours after online publication and is updated daily on week days.
Initial download of the metrics may take a while.