Fig. 2
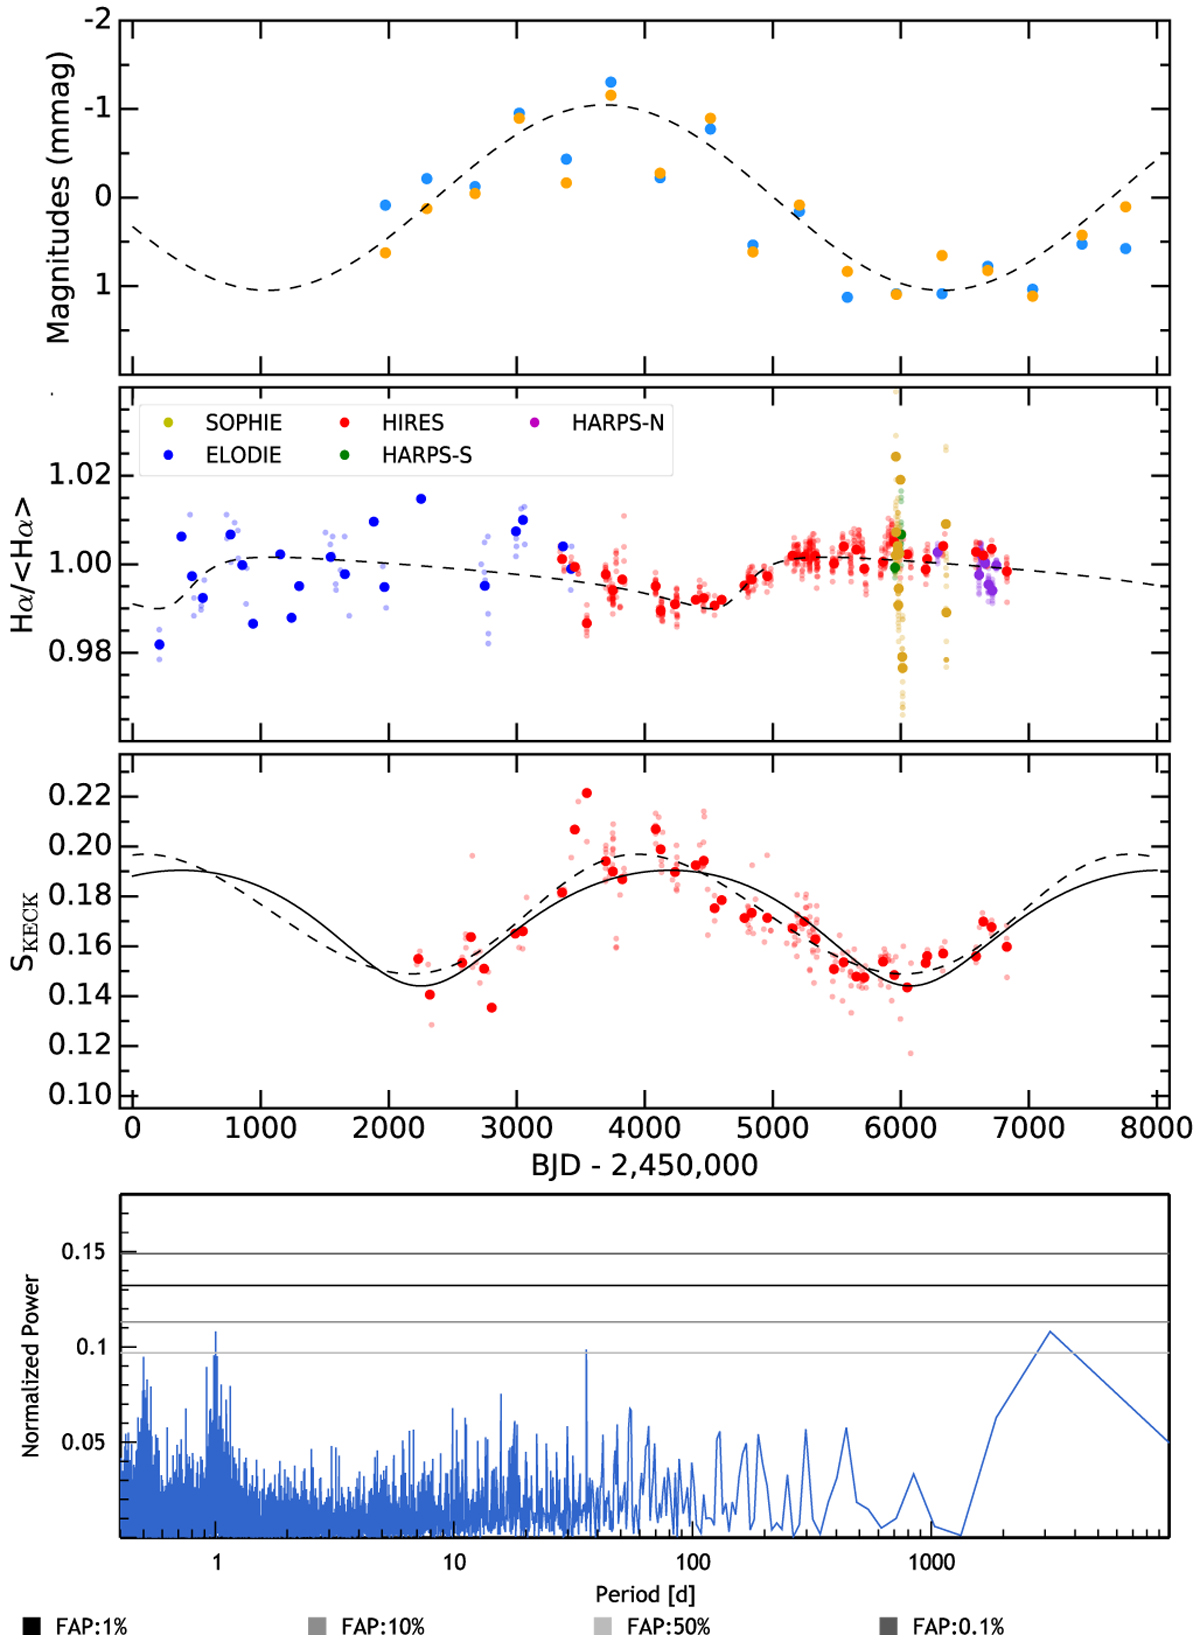
Magnetic cycle of 55 Cnc. First panel: seasonal mean differential magnitudes of 55 Cnc with comparison stars C2 (blue) and C3 (orange), with their best-fit sine function shown as a dashed black curve. Second panel: 55 Cnc Hα activity index and the best-fitted Keplerian to the data (dashed black curve). Third panel: 55 Cnc S activity index derived from KECK HIRES data. The continuous curve represents the best fitted Keplerian to those data, while the dashed curve corresponds to the best Keplerian fitted to the RVs to account for the RV effect of the stellar magnetic cycle (see Table 3 in Sect. 3). Fourth panel: periodogram of the S-index residuals after removing the dashed curve seen in the third panel. The good match between the dashed curve and the continuous one in the third panel, as well as the absence of significant peaks in the periodogram of the S-index residuals, tells us that the extra Keplerian fitted to the RVs in Sect. 3 accounts well for the magnetic cycle effect.
Current usage metrics show cumulative count of Article Views (full-text article views including HTML views, PDF and ePub downloads, according to the available data) and Abstracts Views on Vision4Press platform.
Data correspond to usage on the plateform after 2015. The current usage metrics is available 48-96 hours after online publication and is updated daily on week days.
Initial download of the metrics may take a while.