Fig. 15
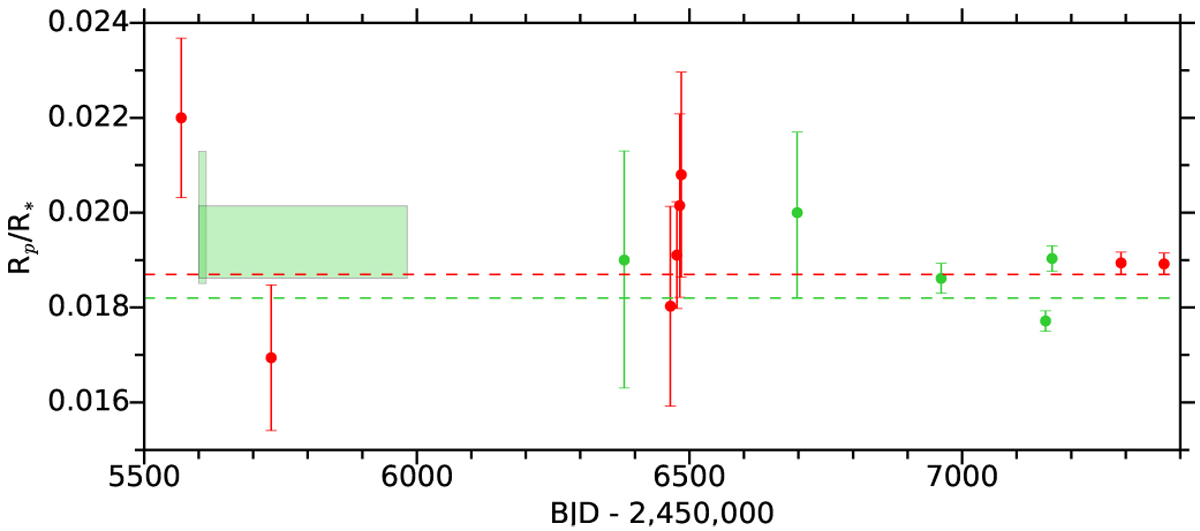
Measurements of 55 Cnc e planet-to-star radius ratio over time. Green points were obtained in optical bands with MOST (Gillon et al. 2012; Dragomir et al. 2014), ALFOSC (de Mooij et al. 2014), HST/STIS (this paper). The first two values are represented as rectangles because they were derived over extended periods of time. The dashed green line shows the value obtained from the fit to the three combined STIS visits. Red points were obtained in infrared bands with Spitzer (Demory et al. 2016b) and HST/WFC3 (Tsiaras et al. 2016). The dashed red line shows the value obtained from the fit to the combined Spitzer visits (Demory et al. 2016b,a).
Current usage metrics show cumulative count of Article Views (full-text article views including HTML views, PDF and ePub downloads, according to the available data) and Abstracts Views on Vision4Press platform.
Data correspond to usage on the plateform after 2015. The current usage metrics is available 48-96 hours after online publication and is updated daily on week days.
Initial download of the metrics may take a while.