| Issue |
A&A
Volume 619, November 2018
|
|
|---|---|---|
| Article Number | A2 | |
| Number of page(s) | 13 | |
| Section | Planets and planetary systems | |
| DOI | https://doi.org/10.1051/0004-6361/201833152 | |
| Published online | 30 October 2018 | |
Planets around evolved intermediate-mass stars
II. Are there really planets around IC 4651 No. 9122, NGC 2423 No. 3, and NGC 4349 No. 127?★,★★
1
Instituto de Astrofísica e Ciências do Espaço, Universidade do Porto, CAUP, Rua das Estrelas,
4150-762
Porto,
Portugal
e-mail: elisa.delgado@astro.up.pt
2
Observatoire de Genève, Université de Genève,
51 ch. des Maillettes,
1290
Sauverny,
Switzerland
3
Departamento de Física e Astronomia, Faculdade de Ciências, Universidade do Porto, Rua do Campo Alegre,
4169-007
Porto,
Portugal
4
Centre for Exoplanet Science, SUPA, School of Physics and Astronomy, University of St Andrews,
St Andrews
KY16 9SS,
UK
5
Instituto de Radioastronomía y Astrofísica, IRyA, UNAM, Campus Morelia,
A.P. 3-72,
C.P. 58089
Michoacán,
Mexico
6
European Southern Observatory,
Alonso de Cordova 3107,
Vitacura,
Santiago,
Chile
7
Dipartimento di Fisica e Astronomia Galileo Galilei, Universitá di Padova, Vicolo dell ́Osservatorio 3,
35122
Padova,
Italy
Received:
3
April
2018
Accepted:
24
July
2018
Aims. The aim of this work is to search for planets around intermediate-mass stars in open clusters using data from an extensive survey with more than 15 yr of observations.
Methods. We obtain high-precision radial velocities (RV) with the HARPS spectrograph for a sample of 142 giant stars in 17 open clusters. We fit Keplerian orbits when a significant periodic signal is detected. We also study the variation of stellar activity indicators and line-profile variations to discard stellar-induced signals.
Results. We present the discovery of a periodic RV signal compatible with the presence of a planet candidate in the 1.15 Gyr open cluster IC 4651 orbiting the 2.06 M⊙ star No. 9122. If confirmed, the planet candidate would have a minimum mass of 7.2 MJ and a period of 747 days. However, we also find that the full width at half maximum (FWHM) of the cross-correlation function (CCF) varies with a period close to the RV, casting doubts on the planetary nature of the signal. We also provide refined parameters for the previously discovered planet around NGC 2423 No. 3, but show evidence that the bisector inverse slope (BIS) of the CCF is correlated with the RV during some of the observing periods. We consider this fact as a warning that this might not be a real planet and that the RV variations could be caused by stellar activity and/or pulsations. Finally, we show that the previously reported signal by a brown dwarf around NGC 4349 No. 127 is presumably produced by stellar activity modulation.
Conclusions. The long-term monitoring of several red giants in open clusters has allowed us to find periodic RV variations in several stars. However, we also show that the follow-up of this kind of stars should last more than one orbital period to detect long-term signals of stellar origin. This work highlights the fact that although it is possible to detect planets around red giants, large-amplitude, long-period RV modulations do exist in such stars that can mimic the presence of an orbiting planetary body. Therefore, we need to better understand how such RV modulations behave as stars evolve along the red giant branch and perform a detailed study of all the possible stellar-induced signals (e.g., spots, pulsations, granulation) to comprehend the origin of RV variations.
Key words: stars: individual: IC 4651 No. 9122 / stars: individual: NGC 2423 No. 3 / stars: individual: NGC 4349 No. 127 / planetary systems / planets and satellites: detection / open clusters and associations: general
Based on observations collected at the La Silla Observatory, ESO (Chile), with HARPS/3.6 m (runs ID 075.C-0140, 076.C-0429, 078.C-0133, 079.C-0329, 080.C-0071, 081.C-0119, 082.C-0333, 083.C-0413, 091.C-0438, 092.C-0282, 099.C-0304, and 0100.C-0888) and with UVES/VLT at the Cerro Paranal Observatory (run 079.C-0131)
RV tables are only available at the CDS via anonymous ftp to cdsarc.u-strasbg.fr (130.79.128.5) or via http://cdsarc.u-strasbg.fr/viz-bin/qcat?J/A+A/619/A2
© ESO 2018
1 Introduction
In the last 20 yr, more than 3500 planets have been discovered, mainly around main sequence (MS) solar type stars (exoplanet.eu; Schneider et al. 2011). One of the most successful methods to detect planets, the radial velocity (RV) technique, is more difficult to use around stars hotter than ~6500 K due to the increase in rotational velocities of those stars and the lack of a sufficient number of spectral lines to determine the velocity shifts in their spectra. Nevertheless, several brown dwarfs and planets have been reported by adapting the RV technique to A–F stars (Galland et al. 2006; Desort et al. 2008; Lagrange et al. 2009; Borgniet et al. 2014, 2017). However, in order to understand the planetary formation mechanisms around early F or A stars we need larger samples, together with the determination of planetary masses. Therefore, the preferred option to solve this issue has been to apply the RV method to K giants, the evolved counterparts of those massive stars, with generally low rotation rates and a larger number of spectral lines in their much cooler spectra when compared with their unevolved MS counterparts (e.g., Frink et al. 2002; Sato et al. 2003; Lovis & Mayor 2007; Niedzielski et al. 2015). This allows to probe a different stellar mass range.
A major issue when interpreting RV variations in red giants is the presence of intrinsic stellar jitter which shows a typical level of 10–15 m s−1 (e.g., Setiawan et al. 2004; Hatzes et al. 2005) and increases towards more evolved stages (Hekker et al. 2008) and for redder stars (Frink et al. 2001). These short-term (a few hours to a few days) low-amplitude RV variations are mainly caused by radial oscillations, that is, p-modes (e.g., Hatzes et al. 2007). On the other hand, long-term non-radial pulsations can produce larger RV amplitudes of hundreds of meters per second (e.g., Hatzes & Cochran 1999), which can eventually mimic the presence of a planet. Moreover, the combination of several modes of radial oscillations can produce night-to-night variations of ~100 m s−1 (e.g., see thecase of α Boo and α Tau; Hatzes & Cochran 1993). The modulation of active regions in red giants can produce large-amplitude RV variations and on longer timescales as well. Therefore, it is important to carry out long-term observations covering more than one period of the planet candidates (and for a time span larger than the stellar rotational period) to evaluate thestability of the hypothetical planetary signal and its possible relation with the rotational period of the star.
Some interesting correlations between metallicity, stellar mass, and the presence of planets have been proposed as more planets havebeen discovered during recent years. Johnson et al. (2010) found that the frequency of massive planets is higher around more massive stars, but later Reffert et al. (2015) reported that the giant planet occurrence rate peaks at ~1.9 M⊙ and then rapidly drops for masses larger than ~2.5–3 M⊙. They also found a clear planet–metallicity correlation for their confirmed planet-host giant star sample. However, the works by Maldonado et al. (2013) and Mortier et al. (2013) only found such correlation for giant stars with masses larger than ~1.5 M⊙.
Therefore, it is clear that in order to understand planet-formation mechanisms we need to get accurate masses for the host stars. One of the main problems in characterizing these evolved planetary systems is that the determination of masses for red giants is complicated by the crowding of evolutionary tracks with similar stellar parameters in that region of the Hertzsprung–Russell (HR) diagram and therefore the determined planetary masses with the RV technique may present very large uncertainties (Lloyd 2011; Sousa et al. 2015, but see Ghezzi & Johnson 2015; North et al. 2017). As a way to address this issue, several programs to discover planets in open clusters have been started. The advantage of working with clusters is that ages and masses of their stars can be better constrained, thus making the planetary characterization more reliable. Despite the efforts to detect those planets, only a few discoveries have been reported. The first planet ever discovered in an open cluster was announced by Sato et al. (2007). This was a long-period planet (595 days) with a minimum mass of 7.6 MJ orbiting a red giant of 2.7 M⊙ in the Hyades (~600 Myr). Soon after, a similar planet was announced around a 2.4 M⊙ giant in NGC 2423 (m2 sin i = 10.6 MJ, P = 750 days) by the RV survey around intermediate-mass stars of Lovis & Mayor (2007; hereafter Paper I). This work also reported the discovery of a brown dwarf orbiting a 3.9 M⊙ red giant in NGC 4349. Finally, Brucalassi et al. (2014) discovered a Jupiter-like planet in a 120-day orbit around a K giant in M67. We note that the search for planets in open clusters has also targeted MS stars with some detections of Neptune-size planets (Meibom et al. 2013) and hot Jupiters in different clusters (Quinn et al. 2012, 2014; Brucalassi et al. 2014, 2016; Malavolta et al. 2016).
The aim of this work is to present the new results of our RV survey started in Paper I which includes the discovery of a long-period planet candidate in IC 4651. The outline of the paper is as follows: in Sect. 2, we present the data and derivation of stellar parameters. The planet candidate found in IC 4651 is debated in Sect. 3 and the discussion of the signals previously attributed to the presence of a planet in NGC 2423 is presented in Sect. 4. In Sect. 5, we provide evidence that the previously discovered signal from a brown dwarf in NGC 4349 is most likely caused by modulation of stellar magnetic activity. Finally, in Sects. 6 and 7, we present a general discussion and conclusions of the results.
2 Observations and sample
The RV sample used in this work is fully described in Paper I. The objects analyzed here have been followed for nearly 5 yr (from March 2005 to October 2009) with HARPS (ESO-3.6 m, La Silla) and some of them were also observed with CORALIE (1.2 m-Swiss Telescope, La Silla) in previous years. In summary, the survey has focused in open clusters observable from La Silla, with bright giants (maximum V = 10 or 13, for each instrument respectively) having masses between 1.5 and 4 M⊙. Moreover, only clusters with at least three giants known to be non-binary cluster members were chosen. Additional observations were made during 2017 and 2018 for the targets showing large RV variations. The observations were made using classical fiber spectroscopy mode (no simultaneous calibration) and the exposure times were estimated in order to have individual spectra with a signal-to-noise ratio (S∕N) ~30. This gives a typical RV photon-noise of ~3.5 m s−1 which is enough to detect massive planets around the surveyed stars.
In total,142 stars were monitored within 17 open clusters using the HARPS spectrograph at the ESO 3.6 m telescope (R ~ 115 000). The stellar parameters, namely the effective temperature (Teff), surface gravity (logg), metallicity ([Fe/H]), and microturbulence (ξt) for most of the clusters were presented in Santos et al. (2009, 2012) and improved upon in Delgado Mena et al. (2016; by using higher-S/N data and a Fe linelist optimized for cool stars) together with the derivation of stellar ages, masses, and radii. In this paper we focus on the results for three stars in the clusters IC 4651, NGC 2423, and NGC 4349. The parameters for those targets are summarized in Table 1.
Stellar characteristics of the analyzed planet host candidates.
3 A planet candidate around IC 4651 No. 9122
3.1 Parent star characteristics
Our sample contains eight giant stars in the open cluster IC 4651 (distance d = 888 pc) with an average metallicity [Fe/H] = 0.06 ± 0.06 dex (see Table B.1 of Delgado Mena et al. 2016). In Fig. 1, we show the HR diagram for this cluster. We use PARSEC isochrones (Bressan et al. 2012) to derive masses and ages (see Table B.2 of Delgado Mena et al. 2016). The isochrone which best matches our stars has an age of 1.41 Gyr, slightly higher than the 1.14 Gyr provided by the WEBDA database1. Our planet candidate host, with Teff = 4720 ± 71 K, log g = 2.72 ± 0.15 dex, M = 2.06 ± 0.09 M⊙, and R = 8.90 ± 0.68 R⊙ (see Table 1) seems to be on the first ascent of the red giant branch (RGB) while most of the other stars seem to be located in the red clump. The mean radial velocity of the giants in this cluster is –30.28 ± 1.33 km s−1 while the mean RV of IC 4651 No. 9122 is –30.26 km s−1; therefore this star is likely a cluster member. We estimated a v sin i of 3.89 km s−1 in Delgado Mena et al. (2016) for a fixed macroturbulence velocity of 2.36 km s−1 (with the empirical formula by Valenti & Fischer 2005). This leads to a maximum rotational period of ~115 days. If we consider the empirical relations for macrotubulence given by Gray (2005) and Hekker & Meléndez (2007) for class III stars, we obtain a macroturbulence velocity of 5.25 km s−1 which causes v sin i to decrease to 0.1 km s−1 (the lowest limit accepted by the procedure to derive v sin i). This is probably an unrealistic value and would lead to a rotational period of 4503 days.
In order to illustrate the stellar jitter of the observations, we plot the RV variations of the stars in the cluster in Fig. A.1. Most of the stars exhibit a scatter around 13 m s−1 while our planet candidate host shows adispersion of 60 m s−1, clearly above the average stellar jitter. This therefore hints at the presence of a planet. The star with the RV dispersion of 26 m s−1 is IC 4651 No. 9791, which shows RV peak to peak variations of 80 m s−1. The photometric survey by Sahay et al. (2014) reported that this star is a long-period variable but could not establish its period due to the limited duration of the observations (130 days). Therefore, it is probable that the variability observed in brightness is related with the scatter in RV and of stellar origin, although it is not possible either to determine any period with our RV data. Interestingly, another two stars in this cluster, No. 8540 and 9025, also show brightness variability as reported by Sahay et al. (2014), which in the case of the latter reaches 0.4 magnitudes with a 73-day cadence. However, the RV scatter for these two stars is lower, 10.8 and 12.1 m s−1, respectively, than the level of the expected noise in these stars. To diagnose these effects we analyze different activity proxies in Sect. 3.4.
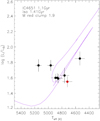 |
Fig. 1 HR diagram for the cluster IC 4651. The purple line is the isochrone of 1.25 Gyr and Z = 0.018 ([Fe/H] = 0.09 dex). The red dot is the planet host IC 4651 No. 9122. |
3.2 The radial velocity dataset
In the upper panel of Fig. A.2, the RV data spanning 12.5 yr of observations is shown. We collected a total of 47 points between ESO periods 75 and 83. These data already allow us to infer the possible presence of a planet but we found hints that the RV variability might be of stellar origin. Therefore, we collected four RV additional points2 during periods 99 and 100 (between April and October 2017). Moreover, we found six extra points taken during 2013 and 2014 in the ESO archive (programs 091.C-0438 and 092.C-0282 by Sanzia Alves et al.) as listed in the online Tables. The typical photon-noise-dominated error in RV of the data is ~3 m s−1. However, the RV variations are usually dominated by the stellar jitter which is much higher in this kind of star as discussed in the previous subsection. For example, solar-like p-mode oscillations in this star are expected to produce an amplitude of ~4 m s−1 and a periodof 0.13 days estimated with the scaling relations of Kjeldsen & Bedding (1995). Since the average scatter in the RV data (for the “stable” stars) is close to 15 m s−1 we decided to quadratically add this noise to the photon noise before fitting the data to determine the planet orbit. We used the yorbit algorithm Ségransan et al. (2011) to fit the whole dataset with a model composed of a Keplerian function. Yorbit uses a hybrid method based on a fast linear algorithm (Levenberg–Marquardt) and genetic operators (breeding, mutations, crossover), and has been optimized to explore the parameter space for Keplerian fitting of radial velocity datasets. In our case, the global search for orbital parameters was made with a genetic algorithm.
An analysis using Generalised Lomb-Scargle (GLS) periodograms (e.g., Zechmeister & Kürster 2009) was performed for RV (see upper panel of Fig. 2). The false-alarm-probability (FAP) was computed by bootstrapping the data and statistically significant peaks were considered for values above FAP = 1%. A significant signal with a period of ~741 days can be clearly observed in the periodogram. This periodic variation is well fitted by a Keplerian function with P = 747 days, K = 100.8 m s−1, and e = 0.15 (see Table 2). These values correspond to the expected signal induced by a planet with 7.2 MJ in a 2.05 au semi-major orbit. The phase curve of the best fitted solution can be seen in Fig. 3. The dispersion of the residuals is 17 m s−1 and the reduced χ2 is 1.34. As a further test we run a Markov chain Monte Carlo (MCMC) to evaluate the white noise in our data. We obtain orbital parameters similar to those found by yorbit and we determine a jitter of 13.5 m s−1 which is very close to the average RV in the cluster. Therefore, we can conclude that the assumption of adding a noise of 15 m s−1 does not alter the results and it is an acceptable solution to treat the stellar-induced noise that cannot be properly modeled with our current data.
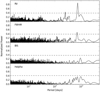 |
Fig. 2 Generalized Lomb–Scargle periodograms of RV, FWHM, BIS, and Hα index for IC 4651 No. 9122. The dashed line indicates the FAP at 1% level. |
Orbital and physical parameters for the planet candidates.
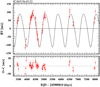 |
Fig. 3 Radial velocity curve as a function of time for IC 4651 No. 9122. The fitted orbit corresponds to a period of 747 days. A stellar jitter of 15 m s−1 has been added to the error bars. |
3.3 Photometry
This star has been observed within the All Sky Automated Survey (ASAS) from the las Campanas Observatory (Chile) with observationsavailable between 2001 and 2009 (Pojmanski 2002), hence contemporaneous to our first set of RV measurements. We found 151 measurements classified as good quality (they are given the grade A or B, with average errors of 0.05 mag) which show a ~0.3 peak-to-peak variability in V magnitude. We downloaded the light curves in V magnitude from the The ASAS-3Photometric V -band Catalogue3 and performed a GLS to detect any possible variability with the same period as the planet candidate. In Fig. 4, we can see that there are two signals just above the FAP = 1% line with periods of 296 and 2273 days. Since we cannot constrain well the rotational period of the star it is difficult to claim whether any of these signals in the photometry correspond to such a period.
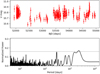 |
Fig. 4 GLS of V magnitude for IC 4651 No. 9122 using ASAS data. The dashed line indicates the FAP at 1% level. |
3.4 Stellar activity and line profile analysis
To investigate activity modulations that could interfere with RV we measured a simultaneous activity index based on the Hα line. We chose not to use the Ca II H&K and Na I D1 & D2 lines due to very low S∕N (<3) on the former and line contamination on the latter. The Hα index was calculated as in Gomes da Silva et al. (2011) and implemented using ACTIN4. The flux in the Hα line was measured at 6562.81 Å with a 1.6 Å bandpass. Two reference lines were measured using two 10.75 and 8.75 Å windows centered at 6550.87 and 6580.31 Å, respectively. We then divided the flux in the Hα line by the two reference lines to obtain the index. The errors on the fluxes were computed using photon noise,  , with N being the total flux in the band, and the error on the index was computed via propagation of errors. To further investigate RV variations caused by stellar atmospheric phenomena, we also used the full-width-at-half-maximum (FWHM) of the cross-correlation function (CCF). These values and their errors are provided by the HARPS pipeline. Moreover, we also analyzed the BisectorInverse Slope (BIS; Queloz et al. 2001) of the CCF but we note that this diagnostic of line asymmetry loses sensitivity for very low stellar rotations such as the case we are studying here (e.g., Saar et al. 1998; Santos et al. 2003, 2014; Queloz et al. 2009).
A periodogram analysis was carried out for FWHM, BIS, and Hα index to search fora possible impact of stellar activity or long-term oscillations on the observed RV (see Fig. 2). The Hα periodogram shows two peaks at 952 and 714 days but they are not statistically significant. Interestingly, there are also peaks at 952 days in the BIS and RV periodograms although they are not significant. On the other hand, the FWHM periodogram also shows a long-period signal at ~714 days, above the FAP = 1% line. This signal is probably due to rotational modulation of active regions in the atmosphere (see e.g., Lambert 1987; Larson et al. 1993) since it matches the same period as Hα index. As explained in Sect. 3.1, the determination of the rotation period is a very degenerate problem (depending on the assumption for macroturbulent velocity) and it is difficult therefore to determine whether or not that signal in the FWHM periodogram is caused by spot modulation. Nevertheless, we note that it has been reported that stars can have long-term activity cycles on top of the typical rotation-modulated cycle (Dumusque et al. 2011; Lovis et al. 2011). The fact that the period of the FWHM lies so close to the period of the planet candidate (which in turn matches one of the peaks of the Hα index periodogram) casts doubt on the planetary hypothesis and is further discussed in Sect. 6. We note that during the referee process of this paper, the work by Leão et al. (2018) announced the presence of a planet around IC 4651 No. 9122 using the same RV data presented here. However, in that work the variation of the FWHM of the CCF was not explored which led the authors to conclude that the signal should be caused by a planet. Our analysis casts doubt on the planetary nature of the periodic signal and shows the importance of analyzing all possible stellar indicators.
Stellar activity and pulsations are also expected to cause deformations in the line profile of spectral lines. Therefore, we also explored any possible correlation between the RV and several line-profile indicators such as FWHM, BIS (Queloz et al. 2001), Vspan (Boisse et al. 2011), biGauss (Nardetto et al. 2006), and Vasy, BIS+ and BIS– (Figueira et al. 2013) by using the python code LineProf.py5 developed by Figueira et al. (2013). We did not find strong correlation for any of the indicators, with a maximum value of the Pearson correlation coefficient of 0.3 for the relation of Vspan with RV.
To further evaluate the significance of the periodic signals for RV we calculated the Stacked Bayesian general Lomb–Scargle (BGLS) periodogram which is shown in Fig. 5. This tool, developed by Mortier & Collier Cameron (2017), aims at tracking the S/N of the detection of a signal over time. If an orbiting body, such as a planet, is the cause of the observed periodic signal, we expect that the signal gets more significant as we add more observations. On the other hand, stellar activity signals are unstable and incoherent and therefore, the Stacked BLGS will show that the probability of having a signal at a given period varies (decreasing or increasing) when adding more data. In Fig. 5, we can see that the peak at ~700 days gets more significant by adding more data and stabilizes after ~50 observations with some small fluctuations. This would be the expected behavior for the signature of a planetary companion.
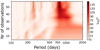 |
Fig. 5 Stacked periodogram for RV measurements in IC 4651 No. 9122. |
4 Is the RV variation of NGC 2423 No. 3 due to the presence of a planet?
In Paper I, showing the first results of this survey, a planet in the cluster NGC 2423 was announced after collecting 46 RV points (28 with CORALIE and 18 with HARPS) during 1529 days. The reported planet had a mass of 10.6 MJ orbiting around NGC 2423 No. 3 with a period of 714.3 days in an orbit of eccentricity 0.21 and semimajor axis 2.1 au. The parent star has a mass of 2.26± 0.07M⊙ and seems to be ascending the RGB; furthermore, it is probably the most evolved star among those surveyed within this cluster. Most of the stars in this cluster exhibit a RV scatter below 30 m s−1 while NGC 2423 No. 3 clearly contrasts with a dispersion of 72 m s−1. We refer thereader to Paper I for the HR diagram and RV jitter histogram for this cluster. The parameters of NGC 2423 No. 3 are detailed in Table 1. For this star we can also estimate the rotational period from the projected rotational velocity. If we consider a macroturbulence velocity of 2.15 m s−1 (with the formula by Gray 2005) we obtain v sin i = 3.84 km s−1. Given that the radius of this star is 13 R⊙ we would obtain a maximum period of 172 days. On the other hand, if we consider the empirical relation of Hekker & Meléndez (2007), the macrotubulence velocity would be 5 km s−1 which leads to a very small v sin i (0.1 km s−1) which in turn corresponds to a maximum rotational period of 6627 days.
4.1 The radial velocity dataset
In Fig. 6, we show the RV data for NGC 2423 No. 3 spanning more than 15 yr of observations (73 observations, 45 of them with HARPS) and the orbital solution obtained with yorbit for a planet with a period of 698.6 days in a circular orbit with a = 2.02 au. The typical photon-noise-dominated errors in RV of the data is ~3 and ~10 m s−1 for HARPS and CORALIE data, respectively. We note that here we have also added an error of 15 m s−1 before fitting the data6. By using the updated stellar mass (2.26 ± 0.07 M⊙) from Delgado Mena et al. (2016) we derive a planetary mass m2 sin i = 9.6 MJ (see Table 2). The period and semi-major axis are very similar to previous values but the eccentricity is significantly lower (the former value was 0.21). The reduced χ2 of the fit is 2.13 and the dispersion of the residuals is 22.4 m s−1, a value similar to the typical error bars in RV considering the stellar jitter. The residuals shown in Fig. 6 seem to have a periodic behavior. A GLS periodogram of the residuals shows two significant peaks around 400 days. Interestingly, this is close to the period of 417 days seen in the photometry (see below). However, we cannot properly fit such residuals with a single Keplerian orbit or a sinusoidal function. We note here that by doing a two-Keplerian fit, for the highest-amplitude signal we would obtain similar orbital parameters as for the single Keplerian while the secondary signal would present a very bad fit. This probably reflects the fact that the residuals we see in the single Keplerian are of stellar origin, caused by different processes with different periods that our data cadence cannot resolve and therefore the residuals cannot be fitted.
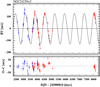 |
Fig. 6 Radial velocity curve as a function of time for NGC 2423 No. 3 using the complete dataset. The fitted orbit corresponds to a period of 698 days. A stellar jitter of 15 m s−1 has been added to the error bars. |
4.2 Photometry
We collected 497 photometric measurements from the ASAS-3 catalog (with grade A or B) taken between 2000 and 2009 with an average error of 0.04 mag. The light curve shows a ~0.15 peak-to-peak variability in V magnitude. After applying a GLS we can see in Fig. 8 a clear peak above the FAP = 1% line with a period of 1124 days. Moreover, there is a second peak just above the FAP line at 417 days. Neither of these periods is close to the RV period but they could be related to the rotation of the star.
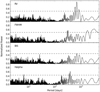 |
Fig. 7 Generalized Lomb–Scargle periodograms of RV, FWHM, BIS, and Hα index for NGC 2423 No. 3. The dashed line indicates the FAP at 1% level. |
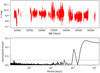 |
Fig. 8 GLS of V magnitude for NGC 2423 No. 3 using ASAS data. The dashed line indicates the FAP at 1% level. |
4.3 Stellar activity and line profile analysis
In order to find any sign of stellar origin in the RV variation for this star we performed a similar analysis as for IC 4651 No. 9122. In Figs. 7 and A.3, we show the time series and periodograms of the HARPS data only. The quality and resolution of CORALIE data does not allow for investigation of the BIS for this star. For this star we could measure the Na I D1 & D2 lines but they do not show any periodic variation. The RV periodogram (Fig. 7) shows a strong peak at ~689.8 days, similar to the period found with the Keplerian fit. The FWHM periodogram presents a significant peak at ~322 days with an alias at ~303 days caused by the long gap in time between the two sets of observations7. The same happens to the Hα periodogram, with a stronger peak at ~392 days and an alias at ~357 days also above the FAP level. This signal might be related to the period of 417 days observed in the photometry and may be produced by rotational modulation of active regions. Finally, the BIS measurements show a peak just above the FAP line with exactly the same periodas the RV variability, 689.8 days.
We also studied a possible relation between the RV and line-profile indicators. In Fig. A.4, we can see how the RV of NGC 2423 No. 3 shows a strong correlation with biGauss and BIS (the Pearson’s correlation coefficient is depicted in each plot). This fact represents a warning that the signals we are observing are possibly related to inhomogeneities in the stellar surface and not with an orbiting body. However, we note that the 18 RV points initially presented in Paper I did not show any correlation with BIS and in some of the observing time windows the BIS is practically flat and thus not correlated with RV (see Fig. A.3). It is interesting however, that the sign of the slope for BIS versus RV is opposite to what is found in many cases in the literature (e.g., Queloz et al. 2001; Boisse et al. 2009; Figueira et al. 2013), as expected for RV variations due to stellar spots. This case resembles that of the slow rotatorHD 41004A (Santos et al. 2002) where BIS shows a strong positive correlation with RV. In that system the best explanation for the RV variation found and the positive correlation with BIS is given by the presence of a brown dwarf around the secondary component HD 41004B (probably an M2 dwarf), which perturbs the contributionto the global CCF dominated by the primary. However, in our case, although there are no reported binary companions around the planet candidate host, we cannot discard the possibility that there is a blended binary. By inspecting the SIMBAD database, we find that a foreground star from the cluster NGC 2422 (PMS 419) with V = 18.5 is at 9.18 arcsec distance from our star. That cluster is closer and younger than NGC 2423 (490 vs. 766 pc as in WEBDA database). By using the simulations done by Cunha et al. (2013) we can estimate a contamination of ~1 m s−1 (consideringthat our target is a K5 star and the difference in apparent magnitude is 8). Therefore, we can reject the hypothesis that such a foreground star is affecting our RV measurements. On the other hand we do not find a correlation of RV with FWHM and the contrast of the CCF as also happens in the case of HD 41004. Moreover, Santerne et al. (2015) simulated different blending scenarios (planet orbiting around a secondary unseen companion) and showed that when the secondary rotates faster than the primary (FWHM1 < FWHM2) a positive correlation between BIS and RV would be observed, as in our case. However, a positive correlation would also be observed for BiGauss and Vspan; here, however, we find a negative correlation for these two line profile indicators. Another case for a positive correlation between BIS and RV was found for the active K giant EK Eri (Dall et al. 2005) which was later reported to have a strong cool spot by Aurière et al. (2011) using the Zeeman–Doppler imaging method.
The real value of v sin i is uncertain, as in the case of IC 4651 No. 9122. Therefore, it is difficult to relate the periodicity of the FWHM with rotational modulation of active regions; we cannot, however, discard that possibility. Indeed, the different peaks observed in the periodograms of FWHM, Hα, and photometry (322, 392, and 417 days) on one hand, and of BIS (689.8 days) on the other, might indicate that the variations of the former are due to rotational modulation whereas the period of the latter is related to stellar pulsations which in turn could also be producing the periodic variation in RV. Indeed, the fact of having a signal with eccentricity close to zero cannot rule out the possibility that pulsations are causing the RV variation (Frink et al. 2002). For this star we find large peak-to-peak RV amplitudes of ~270 m s−1, while BIS variations are much smaller (40 m s−1), which could be a signature of oscillations (Hatzes 1996).
In an attempt to further understand the different signal observed in this star we show the stacked BGLS periodogram of RV in Fig. A.5. The probability of the signal steadily increases by adding new observations, and therefore the signal is stable.
5 A stellar signal disguised as a brown dwarf around NGC 4349 No. 127
In Paper I, a 19.8 MJ substellar companion around NGC 4349 No. 127 was presented with a period of 677.8 days, e = 0.19, K = 188 m s−1, and a = 2.38 au. As for the previous case, this star is also the most evolved in the cluster (see also Paper I and Delgado Mena et al. 2016; for HR diagrams and RV scatter histogram) and clearly stands out with an RV scatter of 70 m s−1 (the average RV jitter is 20 m s−1). The estimated v sin i for this star is 6.1 km s−1 (assuming a macrotubulence velocity of 2.1 km s−1 derived from Valenti & Fischer 2005) and the radius is 37 R⊙ which leads to a maximum rotational period of ~307 days. However, as shown in previous sections, if we consider the macroturbulence given by the Hekker & Meléndez (2007) relation (4.8 km s−1) we obtain v sin i = 4.8 km s−1 and a maximum rotational period of ~390 days. The stellar parameters for this star can also be seen in Table 1.
5.1 Radial velocity dataset
In Fig. 9, we show the time series for RV, FWHM, BIS and Hα for NGC 4349 No. 127. For this star, the Na I D1 and D2 lines are contaminated. This plot includes 46 measurements collected over 1587 days while in Paper I, 20 RV measurements along 784 days were presented. Figure 10 shows the RV, FWHM, BIS and Hα periodograms for NGC 4349 No. 127. The signal attributed to a brown dwarf candidate in Paper I has a significant peak at ~666 days in the RV periodogram which is similar to the period that we also find if we fit a Keplerian orbit to the data (672 days, Fig. 11). This value is very close to the 678 days period derived in Paper I. We obtain a planetary mass m2 sin i = 24.1 MJ and the eccentricity value is 0.05, lower than the previously reported value in Paper I.
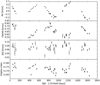 |
Fig. 9 Time-series of RV, FWHM, BIS, and Hα index for NGC 4349 No. 127. |
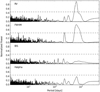 |
Fig. 10 Generalized Lomb-Scargle periodograms of RV, FWHM, BIS, and Hα index for NGC 4349 No. 127. The dashed line indicates the FAP at 1% level. |
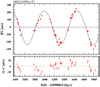 |
Fig. 11 Radial velocity data as a function of time for NGC 4349 No. 127. The fitted orbit corresponds to a period of 672 days. A stellar jitter of 15 m s−1 has been added to the error bars. |
5.2 Stellar activity, photometry, and line profile analysis
In Fig. 10, we can see how the FWHM periodogram also shows a very strong peak at ~666 days (middle panel), indicating that there are variations in the star’s atmosphere with the exact same period as the RV. Moreover, the Hα periodogram also shows a signal at a similar period, with P ~ 689 days (however just below the FAP = 1% level). We can also see a significant signal at 235 days for the FWHM which has a counterpart in the Hα periodogram but with a lower power.
The time-series of RV, FWHM, and Hα clearly show the signals detected in the respective periodograms (see Fig. 10). We note that the amplitude of the FWHM variation is significant (peak-to-peak variation of ~250 m s−1). In the figure, we can observe that FWHM and RV are not in phase. However, stellar, rotationally modulated active regions are known to induce RV signals not in phase with activity proxies (e.g., Queloz et al. 2001; Santos et al. 2014). In their detection paper, Lovis & Mayor (2007) used BIS and the Ca II H&K lines as activity diagnostic tools to validate the candidate brown dwarf. However, BIS loses sensitivity for slow rotators and the stellar flux in the Ca II H&K spectral region for red stars is very low, delivering a low S/N for this activity index. This could explain why the authors missed the strong signals coming from the star’s atmosphere with the same period as the observed RV variations.
For this star we found two independent sets of photometric measurements from the ASAS-3 catalog. In one of the sets we do not find anysignificant peak in the GLS applied to the light curve. The second set is shown in Fig. 12. We find three significant signals in the periodogram with periods of 428, 342, and 1149 days. The first two periods might be related to the rotational period of the star which we have estimated to be in between 300 and 400 days. However, there is no clear signal around the 666-day period found in the RV although we note that the first estimation of the maximum rotational period of ~307 days and the signal in photometry at 342 days are close to the first harmonic (P/2) of the RV period for NGC 4349 No. 127.
On the other hand, we have compared the RV with the line-profile indicators as done in the previous section and we do not find significant correlations among the different indicators. Moreover, we show in Fig. A.6 the stacked BGLS for RV. The signal appears stable and increases its significance when adding more observations, which would be the expected behavior for an orbiting body, but such a trend is also expected if the stellar phenomena responsible for the RV signal is stable over the time interval of our measurements.
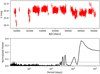 |
Fig. 12 GLS of V magnitude for NGC 4349 No. 127 using ASAS data. The dashed line indicates the FAP at the 1% level. |
6 Discussion
As seen in the sections above there can be different causes for the RV variability detected in our targets besides the presence of planets. Long-period (hundreds of days) RV variations have been known to exist in several giant stars (Walker et al. 1989; Hatzes & Cochran 1993; Larson et al. 1993) with RV amplitudes on the order of ~50–400 m s−1 which were attributed to rotationally modulated active regions (Lambert 1987; Larson et al. 1993) or radial and non-radial pulsations (Hatzes & Cochran 1999), depending on the period of the signal. However, it is not clear yet whether pulsations (and of which kind) can create such high amplitude RV variations as the ones observed. Indeed, stochastically driven p-mode oscillations (also known as solar-type pulsations) are observed in giants from the lower RGB all the way to the AGB evolutionary phase (Mosser et al. 2013), where the most evolved of these are known as semi-regular variables. The properties of these pulsations follow specific scaling relations that can be used to predict their period and amplitude. Considering the stellar parameters estimated for the three stars under study, the expected periods are less than a few days (the dynamical timescale e.g., NGC 2423 No. 3 is ~ 20.8 hr). This therefore rules out the possibility that the variability seen in these stars is due to pulsations excited by a stochastic mechanism. On the other hand, if we were to assume that these types of pulsations could lead to the signal observed, extrapolating from Eq. (9) of Mosser et al. (2013), we would find an rms variability amplitude of 0.78 mag for modes with periods of about 698 days (the case of NGC 2423 No. 3), hence a peak visible magnitude change of 1.1, which is well above what we see here. The use of the scaling relation in Kjeldsen & Bedding (1995) would then point to an rms velocity amplitude of the order of 10 km s−1, several orders of magnitude above what we see here.
Two other types of pulsation are observed in giants, which cannot be explained by a stochastically driven mechanism. The first is the Mira variability, which shows much larger amplitudes than the oscillations discussed above. These are seen only at luminosities much higher than our target stars and therefore can also be ruled out. The second – whose pulsation origin is still under debate (e.g., Takayama et al. 2015; Trabucchi et al. 2017) – has periods of several hundred days, significantly longer than the fundamental radial mode for the stars where they are observed. They appear as a particular sequence in the period–luminosity relation (sequence D) that is yet to be fully understood and are found both during the RGB and the AGB at luminosities log (L∕L⊙) ≳ 2.5 dex. Recently, they have been proposed to be manifestations of oscillatory convective modes (Saio et al. 2015). While in current theoretical models these appear only in giants with log (L∕L⊙) ≳ 3 dex (for a 2 M⊙ star), for models with reasonable convection parameters, the exact minimum luminosity depends on the mass and the mixing length adopted in the treatment of convection. NGC 4349 No. 127 has log (L∕L⊙) ~ 2.7 and could be a candidate for showing this type of pulsation, but we note that the period of 672 days is larger than expected for a typical sequence D star, unless the luminosity is significantly underestimated. The other two stars under study have much lower luminosity, so the presence of this type of pulsations seems to be even less likely, given the theoretical models. Also, their periods would be too long to fit into the sequence D described before. Moreover, the models by Saio et al. (2015) predict large surface temperature variations that are however not observed in our stars8.
In summary, although pulsations are a possibility to explain the long-period variability seen in the RV, after considering the stellar parameters of the stars studied in this paper and the period and amplitude of the variability, we find that the type of pulsations discussed in the literature cannot comfortably explain our observations, with the possible exception of NGC 4349 No. 127. We therefore conclude that either these are not produced by pulsations or they hint at a type of pulsation variability yet to be explained.
Alternatively, stellar activity and/or magnetic fields might be the cause for the RV variability observed in giant stars. Among the three cases exposed in this work, probably, the easiest to explain would be NGC 4349 No. 127 since we find a perfect match between the periods of the RV, the FWHM of the CCF, and the Hα indicator. The variability we observe in these three indicators is therefore presumably caused by rotational modulation of active regions. However, we are still far from fully understanding how the magnetic fields behave in giant stars and what the timescales of stellar activity signals are, since their low rotation rates prevent their study through classical Doppler imaging, a successful technique to characterize the distribution of spots. Starspots with lifetimes of years have been observed with this technique in some stars (Hussain 2002; Strassmeier 2009). For example, polar cap-like starspots appear to have lifetimes of over a decade in RS CVn binaries as well as in young MS stars (Strassmeier 2009). Nevertheless, a handful of giant stars with slow rotation have been studied in the last decade with Zeeman–Doppler imaging, which allows one to obtain the strength and geometry of the surface magnetic field using new high-resolution spectropolarimeters such as Narval, ESPaDOnS, or HARPSpol (Aurière et al. 2015). These authors found that most of the giant stars with detected magnetic fields (the longitudinal component) are undergoing the first dredge-up (i.e., they are close to the RGB base) and few of them are burning He in the core (red clump). Moreover, stars with rotational periods shorter than 200 days seem to have magnetic fields driven by a dynamo as in our Sun. Those stars present a good correlation between the strength of the magnetic field, the chromospheric activity (S-index), and the rotational period. On the other hand, stars such as EK Eri (Aurière et al. 2011) or β Ceti (Tsvetkova et al. 2013)with Prot of 308.8 and 215 days, respectively, probably represent the prototype of descendants of magnetic Ap–Bp stars, hosting fossil magnetic fields. They have strong magnetic fields (|Bl|max > 10 G) with lower-than-expected chromospheric activity. Finally, a last group of stars present very weak (sub Gauss level) but detectable magnetic fields with higher-than-expected chromospheric activity. Among this last group there are several interesting cases such as Pollux, Aldebaran, and Arcturus.
Pollux (β Gem) showsRV variations with a period of 590 days spanning 25 yr (Hatzes et al. 2006) attributed to the presence of a planet. The star does not show any variability in the chromospheric S-index or in the bisector velocity span (Hatzes et al. 2006). The photometric period does not match that of the RV variations either. However, RV values are correlated with the longitudinal magnetic field (Aurière et al. 2009, 2014), casting doubts on the planetary nature of the signals. Aurière et al. (2015) also reported a weak magnetic field in Aldebaran (α Tau) but they could not determine the period of its variability. An extensive study of RV in this star spanning 20yr by Hatzes et al. (2015) reports the presence of a giant planet with a period of ~630 days and modulation of active regions with a period of ~520 days. Finally, a weak magnetic field was also detected in Arcturus (α Boo) by Sennhauser & Berdyugina (2011) with a possible period of 208 days (only 3 measurements were made). The detection was confirmed by Aurière et al. (2015) but no period is provided. Therefore, it remains unclear whether or not the high-amplitude RV variations (500 m s−1) with P = 231 days detected by Hatzes & Cochran (1993) could be caused by the magnetic field. These three cases nicely demonstrate the difficulty in establishing the nature of different signals even when a large amount of data is collected over many years.
With the current data for the three stars studied here it is difficult to determine whether or not stellar chromospheric activity is affecting the RV measurements. When adding all the spectra for a given star to increase the S/N in the blue region we cannot see any sign of emission in the cores of Ca II H&K lines. The semi-amplitude of the BIS has values of ~20 m s−1 for IC 4651 No. 9122 and NGC 2423 No. 3 and ~30 m s−1 for NGC 4349 No. 127. Considering a maximum v sin i of 4 km s−1 for the former and 6 km s−1 for the latter, the presence of spots with a filling factor higher than 5% would be needed to explain the BIS semi-amplitudes (see Fig. 4 of Santos et al. 2003). However, for values of v sin i of 2 km s−1 or lower, the presence of spots would not produce BIS variations. A spot filling factor of 5–10% would produce a variability in V of ~0.05–0.11 mag which is below the peak-to-peak variability we observe for our stars (with approximate values of 0.3, 0.15, and 0.2 mag for IC 4651 No. 9122, NGC 2423 No. 3, and NGC 4349 No. 127, respectively). Therefore, the photometric variability we observe in our stars might be caused by spots (which in turn would produce the observed BIS variations) but the photometric periods do not match either the period of the RV or the period of the BIS for any of the stars.
We find striking the fact that the periods in RV found for the three stars are all close to 700 days. We also find hints that the amplitude and the phase of the signal are changed along the time for the three cases. Curiously, a recent paper by Hatzes et al. (2018) also reports an RV signal in γ Draconis (a K giant with Teff = 3990 K, log g = 1.67, 2.14 M⊙, and L = 510 L⊙) with a semi-amplitude of 148 m s−1 and a period of 702 days that changes in phase and amplitude. It is interesting, though, that they do not find any correlation of RV with the Ca II index or with the BIS. These authors suggest that the variability observed in γ Draconis might be caused by dipole oscillatory convection modes (Saio et al. 2015) which could also be the explanation for the RV variability observed in NGC 4349 No. 127 as discussed above. There are other cases in the literature with long-period RV variations in M giants as well. For example, Lee et al. (2017) reported that the M giant HD 36384 shows photometricvariations with a period of 570 days close to the period of 535 days in the RV. Furthermore, the M giant μ UMa shows RV variations with a period of 471 days with bisector velocity curvature variations of 463 days (Lee et al. 2016). Moreover, the EWs of Hα and Hβ lines show periodic variations with 473 days for this star. Recently, Bang et al. (2018) found RV variations with a period of 719 days in the M giant HD 18438 which also shows photometric and Hα variability with a similar period. All these examples in the literature together with the three stars presented here demonstrate the difficulty of confirming the planetary nature of periodic RV variations in red giants, especially the most massive ones.
In recent years, several works have discussed planet occurrence as a function of stellar mass finding different results (e.g., Omiya et al. 2009; Johnson et al. 2010; Reffert et al. 2015; Jones et al. 2017). When Paper I was published, only six substellar companions9 were known around stars more massive than ~1.78 M⊙ and they presented much higher masses on average than for lower-mass stars (see Fig. 11 in Paper I), leading to the hypothesis that the frequency of massive planets is higher around more massive stars. Certainly, the inclusion of the brown dwarf around the massive star NGC 4349 No. 127 contributed to such a correlation. Later studies by the Korean–Japanese planet search program supported this hypothesis (Omiya et al. 2012). The works by Reffert et al. (2015), Jones et al. (2016) also suggest that the planet occurrence rate increases with stellar mass but peaks around 2 M⊙ and sharply decreases for stars more massive than 2.5–3 M⊙ in agreement with the theoretical model by Kennedy & Kenyon (2008). Indeed, the 12-yr Lick Observatorysurvey (Reffert et al. 2015) did not find any planet around stars more massive than 2.7 M⊙ despite having a significant number of stars with masses up to 5 M⊙. Similarly, the 6-yr EXPRESS survey has not found any planets around stars more massive than 2.5 M⊙ (Jones et al. 2016). Nowadays, in the Extrasolar Planets Encyclopaedia we find only eight stars with masses above 2.7 M⊙ hosting planets or brown dwarfs10, with HD 13189 being the only one more massive than NGC 4349 No. 127, which should now be excluded. Moreover, the two-body system around the 2.8 M⊙ star BD+202 457 seems to be dynamically unstable (Horner et al. 2014), and therefore the determination of planet occurrence rates with surveys covering the high-stellar-mass regime is advisable. As mentioned in the introduction, the measurement of masses for giant stars is a difficult task and several works discuss the suitability of using isochrones compared with other methods, such as asteroseismology, which delivers much more precise masses. In order to carry out a proper statistical analysis evaluating planet occurrence rates, we need to obtain a sample of homogeneously derived masses. Such a study is out of the scope of the present paper but will be approached in a future work when the data collection for our survey in open clusters is completed.
7 Conclusions
In this work, we present the RV data for three stars within the ~5-yr survey of radial velocities in a sample of more than 142 giant stars in 17 open clusters. Additional data were collected over the last 12 months. Such a large span of data is needed in order to find long-period planets since the probability of discovering short-period planets around such giant stars diminishes as the stars evolve and expand their radii. The long-term monitoring of giant stars is also essential to distinguish RV variations caused by the rotational modulation of active regions because the rotational periods of evolved stars are much longer than those of dwarfs.
We report the possible discovery of a 7.2 MJ planet in a 747-day orbit around the star No. 9122 in the intermediate-age open cluster IC 4651. If confirmed, the planet would be at a distance of 2.05 au and the eccentricity of the orbit would be 0.15. However, we find that the FWHM values of the CCF and the Hα index show a periodic behavior with a slightly shorter period than the RV values. The periods of the FWHM and Hα index variation get even closer to that of the RV when adding a few more points taken after 2009. Nevertheless, we note that the significance of the periodic signals on those two indicators is low. We perform further tests on this system to understand whether the periodic RV signals are of stellar origin. Although it is possible to have both a planet and rotational modulation with close periods, we conclude that more data will be needed to validate or refute the presence of such a planet.
This survey already reported two substellar companions in Paper I, NGC 2423 No. 3b, and NGC 4349 No. 127b. These stars were investigated over the 2 yr following publication of Paper I (for NGC 2423 No. 3 additional observations were carriedout during last semester) and here we present an updated analysis of the RV data. We find that the RV variability of NGC 2423 No. 3 is strongly correlated with the BIS of the CCF when using the full dataset, a fact that by itself probably invalidates the planet presence; although we cannot explain the reason for such correlation. However, we note that such correlation is not stable over time and the BIS becomes flat in some of the observed time windows. On the other hand, for NGC 4349 No. 127 we find that the FWHM of the CCF presents a large-amplitude periodic variation with the same strong peak as the RV. Moreover, the periodogram of the Hα index also shows a peak with a similar period very close to the 1% FAP level. Therefore, we believe that rather than a substellar companion, it is the presence of active regions in the atmosphere that is responsible for the RV variability. For this star, the presence of a new kind of stellar pulsation might also be a plausible explanation for the observed variability.
Long-term period signals have been observed in many K giants either produced by stellar activity or by oscillations. The amplitudes of these signals can also reach hundreds of m s−1, mimicking the presence of giant planets. The three cases presented in this work are a clear example of the need to perform detailed analysis of RV modulations in giant stars before the real nature of a planetary signal can be assumed. Moreover, the analysis of the FWHM of the CCF has proven to be essential in order to discard the presence of a companion but we note that this indicator is not widely used in the validation of planets around evolved stars. Finally, further theoretical and observational study is needed to develop our understanding of the different nature of stellar oscillations in evolved stars.
Acknowledgements
We thank François Bouchy and Xavier Dumusque for coordinating the shared observations with HARPS and all the observers who helped collecting the data. E.D.M., V.A., P.F., N.C.S., S.G.S., and J.P.F. acknowledge the support from Fundaçãopara a Ciência e a Tecnologia (FCT) through national funds and from FEDER through COMPETE2020 by the following grants: UID/FIS/04434/2013 & POCI–01–0145-FEDER–007672, PTDC/FIS-AST/1526/2014 & POCI–01–0145-FEDER–016886, PTDC/ FIS-AST/7073/2014 & POCI-01-0145-FEDER-016880 and POCI-01-0145-FEDER-028953. E.D.M. acknowledges the support from FCT through Investigador FCT contract IF/00849/2015/CP1273/CT0003 and in the form of an exploratory project withthe same reference. V.A., P.F., N.C.S., S.G.S., and M.C. also acknowledge the support from FCT through Investigador FCT contracts IF/00650/2015/CP1273/CT0001, IF/01037/2013/CP1191/CT0001, IF/00169/ 2012/CP0150/CT0002, IF/00028/2014/CP1215/CT0002, and IF/00894/2012/ CP0150/CT0004. J.P.F. acknowledges support by the fellowships SFRH/BD/ 93848/2013 funded by FCT (Portugal) and POPH/FSE (EC). PF further acknowledges support from Fundação para a Ciência e a Tecnologia (FCT) in the form of an exploratory project of reference IF/01037/2013/CP1191/CT0001. AM acknowledges funding from the European Union Seventh Framework Programme (FP7/2007-2013) under grant agreement number 313014 (ETAEARTH). This research has made use of the The Extrasolar Planets Encyclopaedia, SIMBAD and WEBDA databases. This work has also made use of the IRAF facility.
Appendix A Additional figures
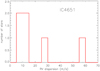 |
Fig. A.1 Standard deviation of RV for members in the cluster IC 4651. Two stars with dispersions higher than 100 m s−1 (due to stellar or brown dwarf companions) are not shown here. |
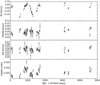 |
Fig. A.2 Time series of RV, FWHM, BIS, and Hα index for IC 4651 No. 9122. |
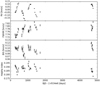 |
Fig. A.3 Time series of RV, FWHM, BIS, and Hα index for NGC 2423 No. 3. |
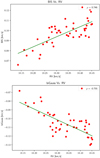 |
Fig. A.4 Correlation between RV and the line profile indicators BIS and biGauss for NGC 2423 No. 3. |
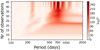 |
Fig. A.5 Stacked periodogram for RV measurements in NGC 2423 No. 3. |
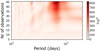 |
Fig. A.6 Stacked periodogram for RV measurements in NGC 4349 No. 127. |
References
- Aurière, M., Wade, G. A., Konstantinova-Antova, R., et al. 2009, A&A, 504, 231 [NASA ADS] [CrossRef] [EDP Sciences] [Google Scholar]
- Aurière, M., Konstantinova-Antova, R., Petit, P., et al. 2011, A&A, 534, A139 [CrossRef] [EDP Sciences] [Google Scholar]
- Aurière, M., Konstantinova-Antova, R., Espagnet, O., et al. 2014, in Magnetic Fields throughout Stellar Evolution, eds. P. Petit, M. Jardine, & H. C. Spruit, IAU Symp., 302, 359 [NASA ADS] [Google Scholar]
- Aurière, M., Konstantinova-Antova, R., Charbonnel, C., et al. 2015, A&A, 574, A90 [Google Scholar]
- Bang, T.-Y., Lee, B.-C., Jeong, G.-H., Han, I., & Park, M.-G. 2018, J. Korean Astron. Soc., 51, 17 [NASA ADS] [Google Scholar]
- Boisse, I., Moutou, C., Vidal-Madjar, A., et al. 2009, A&A, 495, 959 [NASA ADS] [CrossRef] [EDP Sciences] [Google Scholar]
- Boisse, I., Bouchy, F., Hébrard, G., et al. 2011, A&A, 528, A4 [NASA ADS] [CrossRef] [EDP Sciences] [Google Scholar]
- Borgniet, S., Boisse, I., Lagrange, A.-M., et al. 2014, A&A, 561, A65 [NASA ADS] [CrossRef] [EDP Sciences] [Google Scholar]
- Borgniet, S., Lagrange, A.-M., Meunier, N., & Galland, F. 2017, A&A, 599, A57 [NASA ADS] [CrossRef] [EDP Sciences] [Google Scholar]
- Bressan, A., Marigo, P., Girardi, L., et al. 2012, MNRAS, 427, 127 [NASA ADS] [CrossRef] [Google Scholar]
- Brucalassi, A., Pasquini, L., Saglia, R., et al. 2014, A&A, 561, L9 [NASA ADS] [CrossRef] [EDP Sciences] [Google Scholar]
- Brucalassi, A., Pasquini, L., Saglia, R., et al. 2016, A&A, 592, L1 [NASA ADS] [CrossRef] [EDP Sciences] [Google Scholar]
- Cunha, D., Figueira, P., Santos, N. C., Lovis, C., & Boué, G. 2013, A&A, 550, A75 [NASA ADS] [CrossRef] [EDP Sciences] [Google Scholar]
- Dall, T. H., Bruntt, H., & Strassmeier, K. G. 2005, A&A, 444, 573 [NASA ADS] [CrossRef] [EDP Sciences] [Google Scholar]
- Delgado Mena, E., Tsantaki, M., Sousa, S. G., et al. 2016, A&A, 587, A66 [NASA ADS] [CrossRef] [EDP Sciences] [Google Scholar]
- Desort, M., Lagrange, A.-M., Galland, F., et al. 2008, A&A, 491, 883 [NASA ADS] [CrossRef] [EDP Sciences] [Google Scholar]
- Dumusque, X., Lovis, C., Ségransan, D., et al. 2011, A&A, 535, A55 [NASA ADS] [CrossRef] [EDP Sciences] [Google Scholar]
- Figueira, P., Santos, N. C., Pepe, F., Lovis, C., & Nardetto, N. 2013, A&A, 557, A93 [NASA ADS] [CrossRef] [EDP Sciences] [Google Scholar]
- Frink, S., Quirrenbach, A., Fischer, D., Röser, S., & Schilbach, E. 2001, PASP, 113, 173 [Google Scholar]
- Frink, S., Mitchell, D. S., Quirrenbach, A., et al. 2002, ApJ, 576, 478 [Google Scholar]
- Galland, F., Lagrange, A.-M., Udry, S., et al. 2006, A&A, 452, 709 [NASA ADS] [CrossRef] [EDP Sciences] [Google Scholar]
- Ghezzi, L., & Johnson, J. A. 2015, ApJ, 812, 96 [NASA ADS] [CrossRef] [Google Scholar]
- Gomes da Silva, J., Santos, N. C., Bonfils, X., et al. 2011, A&A, 534, A30 [NASA ADS] [CrossRef] [EDP Sciences] [Google Scholar]
- Gray, D. F. 2005, The Observation and Analysis of Stellar Photospheres (Cambridge: Cambridge University Press) [Google Scholar]
- Hatzes, A. P. 1996, PASP, 108, 839 [NASA ADS] [CrossRef] [Google Scholar]
- Hatzes, A. P., & Cochran, W. D. 1993, ApJ, 413, 339 [CrossRef] [Google Scholar]
- Hatzes, A. P., & Cochran, W. D. 1999, MNRAS, 304, 109 [NASA ADS] [CrossRef] [Google Scholar]
- Hatzes, A. P., Guenther, E. W., Endl, M., et al. 2005, A&A, 437, 743 [NASA ADS] [CrossRef] [EDP Sciences] [Google Scholar]
- Hatzes, A. P., Cochran, W. D., Endl, M., et al. 2006, A&A, 457, 335 [NASA ADS] [CrossRef] [EDP Sciences] [Google Scholar]
- Hatzes, A. P., Döllinger, M. P., & Endl, M. 2007, Commun. Asteroseismol., 150, 115 [NASA ADS] [CrossRef] [Google Scholar]
- Hatzes, A. P., Cochran, W. D., Endl, M., et al. 2015, A&A, 580, A31 [NASA ADS] [CrossRef] [EDP Sciences] [Google Scholar]
- Hatzes, A. P., Endl, M., Cochran, W. D., et al. 2018, AJ, 155, 120 [NASA ADS] [CrossRef] [Google Scholar]
- Hekker, S., & Meléndez, J. 2007, A&A, 475, 1003 [NASA ADS] [CrossRef] [EDP Sciences] [Google Scholar]
- Hekker, S., Snellen, I. A. G., Aerts, C., et al. 2008, A&A, 480, 215 [NASA ADS] [CrossRef] [EDP Sciences] [Google Scholar]
- Horner, J., Wittenmyer, R. A., Hinse, T. C., & Marshall, J. P. 2014, MNRAS, 439, 1176 [NASA ADS] [CrossRef] [Google Scholar]
- Hussain, G. A. J. 2002, Astron. Nachr., 323, 349 [NASA ADS] [CrossRef] [Google Scholar]
- Johnson, J. A., Aller, K. M., Howard, A. W., & Crepp, J. R. 2010, PASP, 122, 905 [Google Scholar]
- Jones, M. I., Jenkins, J. S., Brahm, R., et al. 2016, A&A, 590, A38 [NASA ADS] [CrossRef] [EDP Sciences] [Google Scholar]
- Jones, M. I., Brahm, R., Wittenmyer, R. A., et al. 2017, A&A, 602, A58 [NASA ADS] [CrossRef] [EDP Sciences] [Google Scholar]
- Kennedy, G. M., & Kenyon, S. J. 2008, ApJ, 673, 502 [Google Scholar]
- Kjeldsen, H., & Bedding, T. R. 1995, A&A, 293, 87 [NASA ADS] [Google Scholar]
- Lagrange, A.-M., Desort, M., Galland, F., Udry, S., & Mayor, M. 2009, A&A, 495, 335 [NASA ADS] [CrossRef] [EDP Sciences] [Google Scholar]
- Lambert, D. L. 1987, ApJS, 65, 255 [NASA ADS] [CrossRef] [Google Scholar]
- Larson, A. M., Irwin, A. W., Yang, S. L. S., et al. 1993, PASP, 105, 825 [Google Scholar]
- Leão, I. C., Canto Martins, B. L., Alves, S., et al. 2018, ArXiv e-prints [arXiv:1807.03196] [Google Scholar]
- Lee, B.-C., Han, I., Park, M.-G., et al. 2016, AJ, 151, 106 [Google Scholar]
- Lee, B.-C., Jeong, G., Park, M.-G., et al. 2017, ApJ, 844, 36 [NASA ADS] [CrossRef] [Google Scholar]
- Lloyd, J. P. 2011, ApJ, 739, L49 [Google Scholar]
- Lo Curto, G., Pepe, F., Avila, G., et al. 2015, The Messenger, 162, 9 [NASA ADS] [Google Scholar]
- Lovis, C., & Mayor, M. 2007, A&A, 472, 657 [NASA ADS] [CrossRef] [EDP Sciences] [Google Scholar]
- Lovis, C., Dumusque, X., Santos, N. C., et al. 2011, ArXiv e-prints [arXiv:1107.5325] [Google Scholar]
- Malavolta, L., Nascimbeni, V., Piotto, G., et al. 2016, A&A, 588, A118 [NASA ADS] [CrossRef] [EDP Sciences] [Google Scholar]
- Maldonado, J., Villaver, E., & Eiroa, C. 2013, A&A, 554, A84 [NASA ADS] [CrossRef] [EDP Sciences] [Google Scholar]
- Meibom, S., Torres, G., Fressin, F., et al. 2013, Nature, 499, 55 [NASA ADS] [CrossRef] [Google Scholar]
- Mortier, A., & Collier Cameron A. 2017, A&A, 601, A110 [NASA ADS] [CrossRef] [EDP Sciences] [Google Scholar]
- Mortier, A., Santos, N. C., Sousa, S. G., et al. 2013, A&A, 557, A70 [NASA ADS] [CrossRef] [EDP Sciences] [Google Scholar]
- Mosser, B., Dziembowski, W. A., Belkacem, K., et al. 2013, A&A, 559, A137 [CrossRef] [EDP Sciences] [Google Scholar]
- Nardetto, N., Mourard, D., Kervella, P., et al. 2006, A&A, 453, 309 [NASA ADS] [CrossRef] [EDP Sciences] [Google Scholar]
- Niedzielski, A., Villaver, E., Wolszczan, A., et al. 2015, A&A, 573, A36 [NASA ADS] [CrossRef] [EDP Sciences] [Google Scholar]
- North, T. S. H., Campante, T. L., Miglio, A., et al. 2017, MNRAS, 472, 1866 [Google Scholar]
- Omiya, M., Izumiura, H., Han, I., et al. 2009, PASJ, 61, 825 [NASA ADS] [Google Scholar]
- Omiya, M., Han, I., Izumioura, H., et al. 2012, PASJ, 64, 34 [NASA ADS] [CrossRef] [Google Scholar]
- Pojmanski, G. 2002, Acta Astron., 52, 397 [NASA ADS] [Google Scholar]
- Queloz, D., Henry, G. W., Sivan, J. P., et al. 2001, A&A, 379, 279 [NASA ADS] [CrossRef] [EDP Sciences] [Google Scholar]
- Queloz, D., Bouchy, F., Moutou, C., et al. 2009, A&A, 506, 303 [NASA ADS] [CrossRef] [EDP Sciences] [Google Scholar]
- Quinn, S. N., White, R. J., Latham, D. W., et al. 2012, ApJ, 756, L33 [NASA ADS] [CrossRef] [Google Scholar]
- Quinn, S. N., White, R. J., Latham, D. W., et al. 2014, ApJ, 787, 27 [NASA ADS] [CrossRef] [Google Scholar]
- Reffert, S., Bergmann, C., Quirrenbach, A., Trifonov, T., & Künstler, A. 2015, A&A, 574, A116 [NASA ADS] [CrossRef] [EDP Sciences] [Google Scholar]
- Saar, S. H., Butler, R. P., & Marcy, G. W. 1998, ApJ, 498, L153 [NASA ADS] [CrossRef] [Google Scholar]
- Sahay, A., Lebzelter, T., & Wood, P. 2014, IBVS, 6107, 1 [NASA ADS] [Google Scholar]
- Saio, H., Wood, P. R., Takayama, M., & Ita, Y. 2015, MNRAS, 452, 3863 [Google Scholar]
- Santerne, A., Díaz, R. F., Almenara, J.-M., et al. 2015, MNRAS, 451, 2337 [NASA ADS] [CrossRef] [Google Scholar]
- Santos, N. C., Mayor, M., Naef, D., et al. 2002, A&A, 392, 215 [NASA ADS] [CrossRef] [EDP Sciences] [Google Scholar]
- Santos, N. C., Udry, S., Mayor, M., et al. 2003, A&A, 406, 373 [NASA ADS] [CrossRef] [EDP Sciences] [Google Scholar]
- Santos, N. C., Lovis, C., Pace, G., Melendez, J., & Naef, D. 2009, A&A, 493, 309 [NASA ADS] [CrossRef] [EDP Sciences] [Google Scholar]
- Santos, N. C., Lovis, C., Melendez, J., et al. 2012, A&A, 538, A151 [NASA ADS] [CrossRef] [EDP Sciences] [Google Scholar]
- Santos, N. C., Mortier, A., Faria, J. P., et al. 2014, A&A, 566, A35 [NASA ADS] [CrossRef] [EDP Sciences] [Google Scholar]
- Sato, B., Ando, H., Kambe, E., et al. 2003, in Scientific Frontiers in Research on Extrasolar Planets, eds. D. Deming, & S. Seager, ASP Conf. Ser., 294, 51 [NASA ADS] [Google Scholar]
- Sato, B., Izumiura, H., Toyota, E., et al. 2007, ApJ, 661, 527 [NASA ADS] [CrossRef] [Google Scholar]
- Schneider, J., Dedieu, C., Le Sidaner, P., Savalle, R., & Zolotukhin, I. 2011, A&A, 532, A79 [NASA ADS] [CrossRef] [EDP Sciences] [Google Scholar]
- Ségransan, D., Mayor, M., Udry, S., et al. 2011, A&A, 535, A54 [NASA ADS] [CrossRef] [EDP Sciences] [Google Scholar]
- Sennhauser, C., & Berdyugina, S. V. 2011, A&A, 529, A100 [NASA ADS] [CrossRef] [EDP Sciences] [Google Scholar]
- Setiawan, J., Pasquini, L., da Silva, L., et al. 2004, A&A, 421, 241 [Google Scholar]
- Sousa, S. G., Santos, N. C., Mortier, A., et al. 2015, A&A, 576, A94 [NASA ADS] [CrossRef] [EDP Sciences] [Google Scholar]
- Strassmeier, K. G. 2009, A&ARv, 17, 251 [Google Scholar]
- Takayama, M., Wood, P. R., & Ita, Y. 2015, MNRAS, 448, 464 [Google Scholar]
- Trabucchi, M., Wood, P. R., Montalbán, J., et al. 2017, ApJ, 847, 139 [Google Scholar]
- Tsvetkova, S., Petit, P., Aurière, M., et al. 2013, A&A, 556, A43 [NASA ADS] [CrossRef] [EDP Sciences] [Google Scholar]
- Valenti, J. A., & Fischer, D. A. 2005, ApJS, 159, 141 [Google Scholar]
- Walker, G. A. H., Yang, S., Campbell, B., & Irwin, A. W. 1989, ApJ, 343, L21 [NASA ADS] [CrossRef] [Google Scholar]
- Zechmeister, M., & Kürster, M. 2009, A&A, 496, 577 [CrossRef] [EDP Sciences] [Google Scholar]
We note that we have applied a small negative offset to the RV points taken after 2015, when an upgrade of the HARPS fibers took place (Lo Curto et al. 2015). The shift was calculated by extrapolating the measurements of Table 3 in Lo Curto et al. (2015) to the full width at half maximum (FWHM) of the spectra for this star.
ACTIN is a FITS extractor and Activity Index calculator tool implemented in Python and available at https://github.com/gomesdasilva/ACTIN.
All Tables
All Figures
|
Fig. 1 HR diagram for the cluster IC 4651. The purple line is the isochrone of 1.25 Gyr and Z = 0.018 ([Fe/H] = 0.09 dex). The red dot is the planet host IC 4651 No. 9122. |
| In the text | |
|
Fig. 2 Generalized Lomb–Scargle periodograms of RV, FWHM, BIS, and Hα index for IC 4651 No. 9122. The dashed line indicates the FAP at 1% level. |
| In the text | |
|
Fig. 3 Radial velocity curve as a function of time for IC 4651 No. 9122. The fitted orbit corresponds to a period of 747 days. A stellar jitter of 15 m s−1 has been added to the error bars. |
| In the text | |
|
Fig. 4 GLS of V magnitude for IC 4651 No. 9122 using ASAS data. The dashed line indicates the FAP at 1% level. |
| In the text | |
|
Fig. 5 Stacked periodogram for RV measurements in IC 4651 No. 9122. |
| In the text | |
|
Fig. 6 Radial velocity curve as a function of time for NGC 2423 No. 3 using the complete dataset. The fitted orbit corresponds to a period of 698 days. A stellar jitter of 15 m s−1 has been added to the error bars. |
| In the text | |
|
Fig. 7 Generalized Lomb–Scargle periodograms of RV, FWHM, BIS, and Hα index for NGC 2423 No. 3. The dashed line indicates the FAP at 1% level. |
| In the text | |
|
Fig. 8 GLS of V magnitude for NGC 2423 No. 3 using ASAS data. The dashed line indicates the FAP at 1% level. |
| In the text | |
|
Fig. 9 Time-series of RV, FWHM, BIS, and Hα index for NGC 4349 No. 127. |
| In the text | |
|
Fig. 10 Generalized Lomb-Scargle periodograms of RV, FWHM, BIS, and Hα index for NGC 4349 No. 127. The dashed line indicates the FAP at 1% level. |
| In the text | |
|
Fig. 11 Radial velocity data as a function of time for NGC 4349 No. 127. The fitted orbit corresponds to a period of 672 days. A stellar jitter of 15 m s−1 has been added to the error bars. |
| In the text | |
|
Fig. 12 GLS of V magnitude for NGC 4349 No. 127 using ASAS data. The dashed line indicates the FAP at the 1% level. |
| In the text | |
|
Fig. A.1 Standard deviation of RV for members in the cluster IC 4651. Two stars with dispersions higher than 100 m s−1 (due to stellar or brown dwarf companions) are not shown here. |
| In the text | |
|
Fig. A.2 Time series of RV, FWHM, BIS, and Hα index for IC 4651 No. 9122. |
| In the text | |
|
Fig. A.3 Time series of RV, FWHM, BIS, and Hα index for NGC 2423 No. 3. |
| In the text | |
|
Fig. A.4 Correlation between RV and the line profile indicators BIS and biGauss for NGC 2423 No. 3. |
| In the text | |
|
Fig. A.5 Stacked periodogram for RV measurements in NGC 2423 No. 3. |
| In the text | |
|
Fig. A.6 Stacked periodogram for RV measurements in NGC 4349 No. 127. |
| In the text | |
Current usage metrics show cumulative count of Article Views (full-text article views including HTML views, PDF and ePub downloads, according to the available data) and Abstracts Views on Vision4Press platform.
Data correspond to usage on the plateform after 2015. The current usage metrics is available 48-96 hours after online publication and is updated daily on week days.
Initial download of the metrics may take a while.