Fig. 6
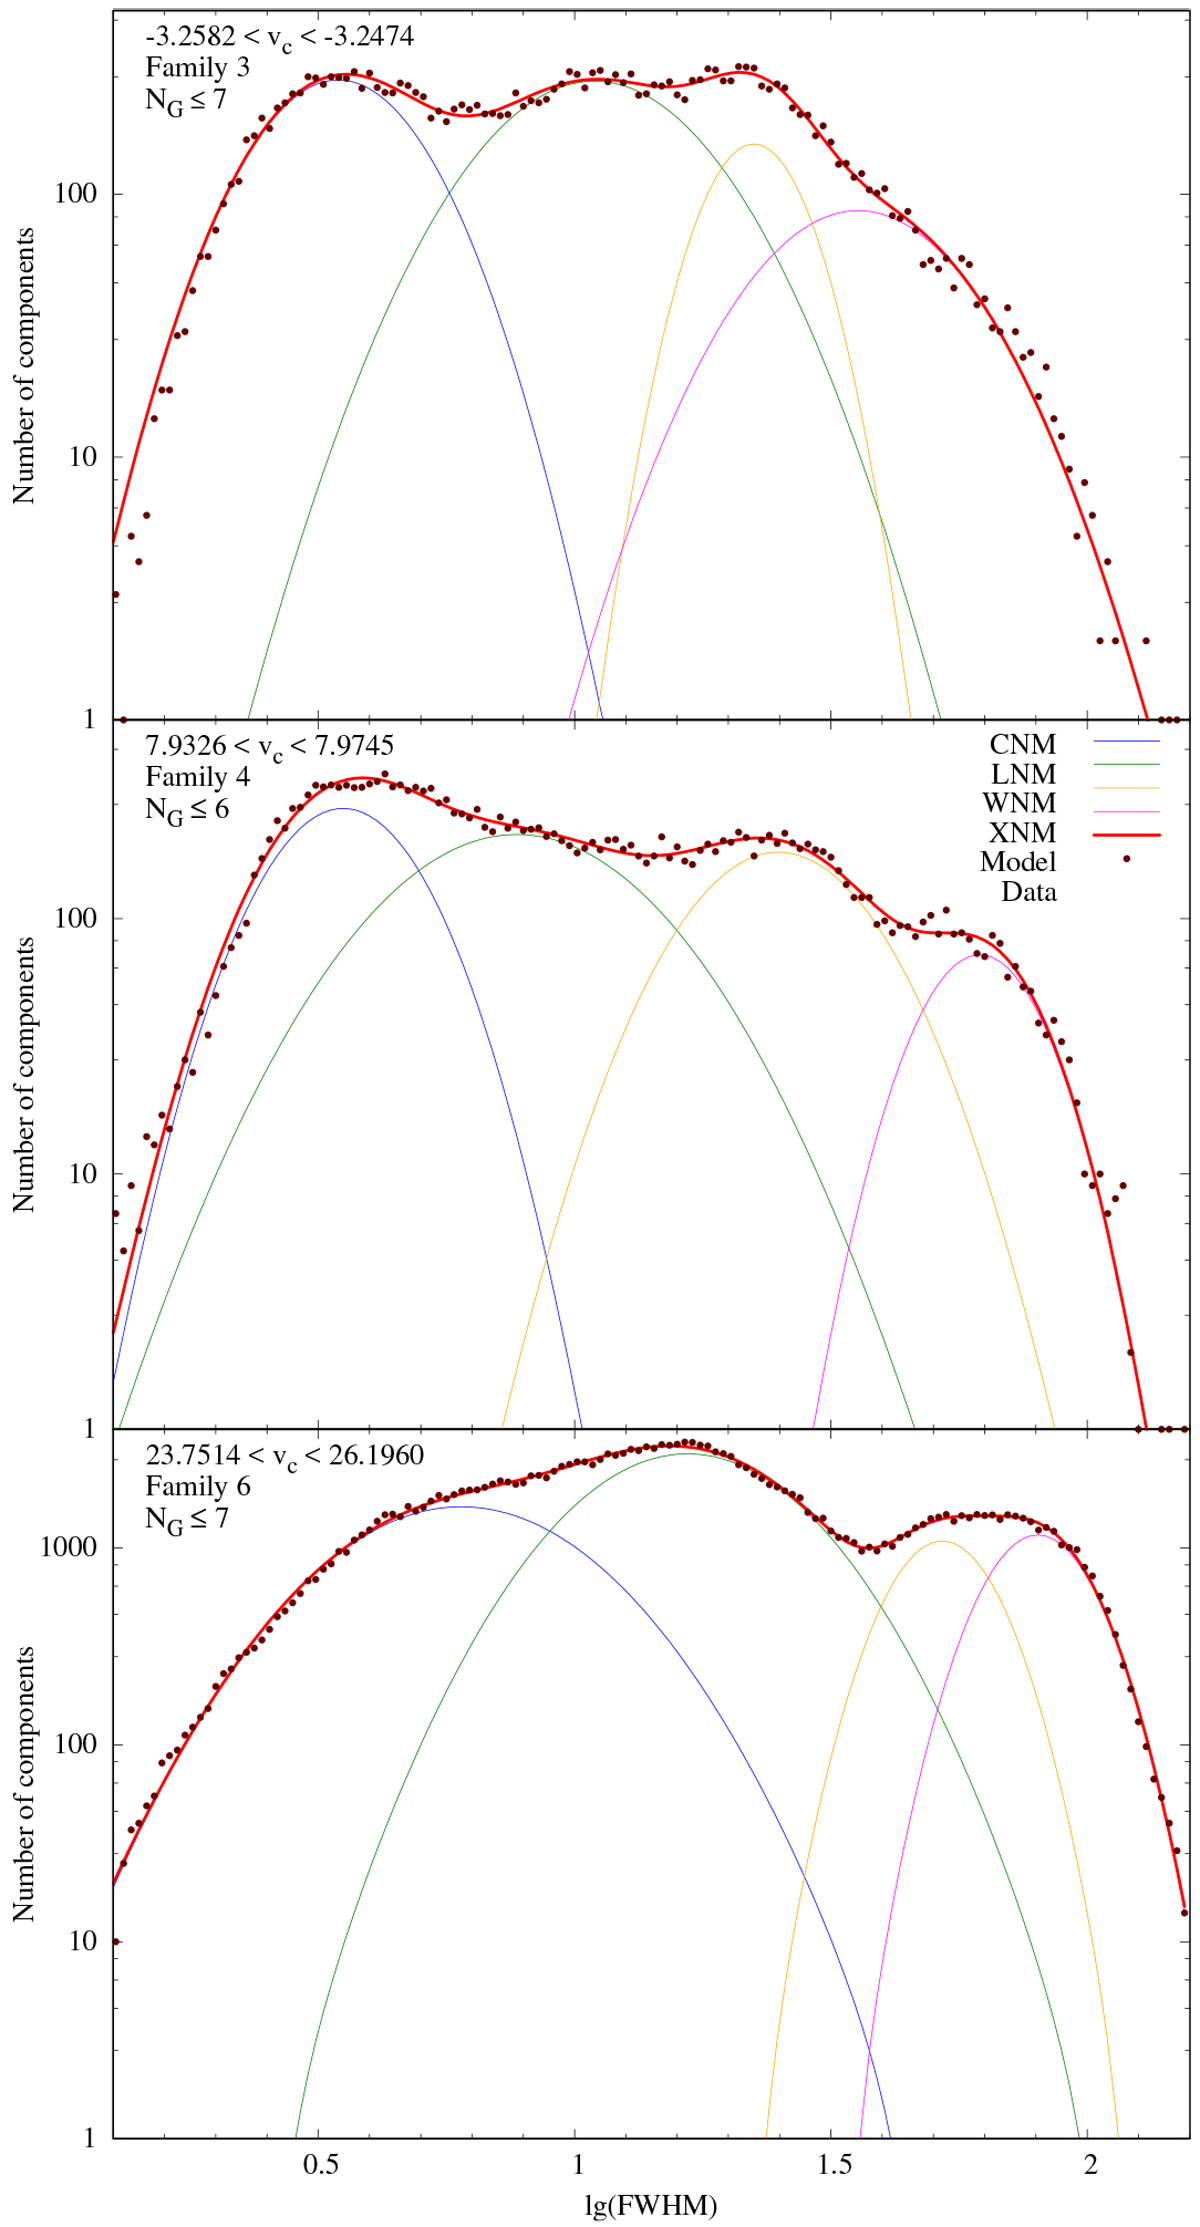
Three examples of the models from the last four families. In the upper panel is the model from the velocity range, where the LNM is most clearly visible in Fig. 4. The middle panel corresponds to the velocities, close to the limit |vc | ≤ 8 km s−1, used for the discussions in the present paper and the lower panel illustrates the situation at extreme velocities |vc | = 25 km s−1, used for Fig. 7.
Current usage metrics show cumulative count of Article Views (full-text article views including HTML views, PDF and ePub downloads, according to the available data) and Abstracts Views on Vision4Press platform.
Data correspond to usage on the plateform after 2015. The current usage metrics is available 48-96 hours after online publication and is updated daily on week days.
Initial download of the metrics may take a while.