Fig. 4
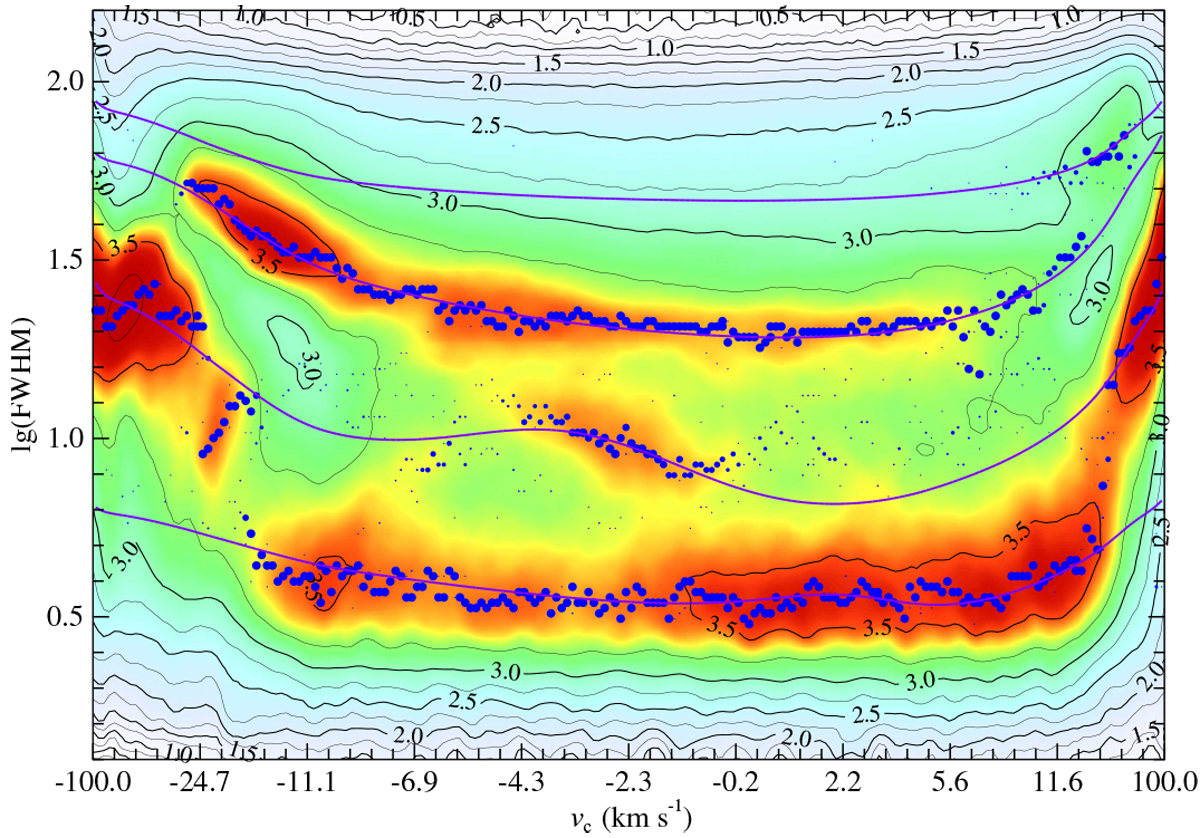
Frequency distribution of the 42 488 690 Gaussians, used for the modeling of the line-width distributions of the gas phases, in the component central velocity – line-width plane. Blue points mark the local maxima in the frequency distribution of the Gaussian line widths at different velocities and the magenta lines represent initial estimates of the centers of four log-normal model distributions of the Gaussian widths in different gas phases. As abscissa we have used the quantiles of the velocity distribution of the used Gaussians. The numbers mark the values of the deciles.
Current usage metrics show cumulative count of Article Views (full-text article views including HTML views, PDF and ePub downloads, according to the available data) and Abstracts Views on Vision4Press platform.
Data correspond to usage on the plateform after 2015. The current usage metrics is available 48-96 hours after online publication and is updated daily on week days.
Initial download of the metrics may take a while.