Fig. 11
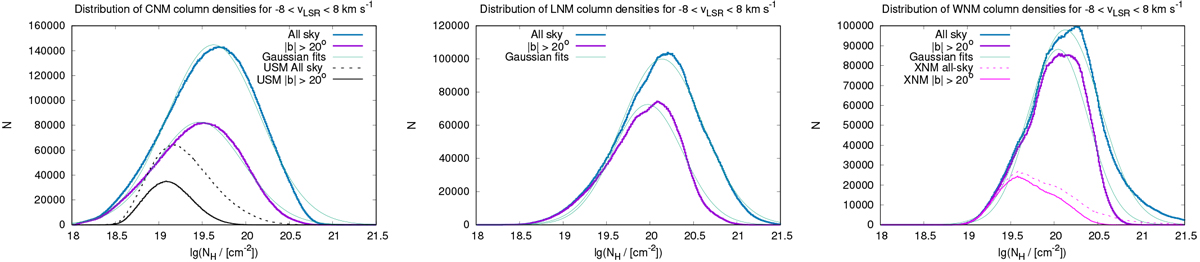
Distribution functions for column densities lg(NH∕[cm−2]) of the CNM (left), LNM (middle), and WNM (right), derived from Gaussian components in the velocity range − 8 < vLSR < 8 km s−1. The light and dark blue colors distinguishes distributions for all Sky and |b| > 20°. The green lines show in each case least square Gaussian fits, resulting in log-normal distributions. For the CNM (left panel) we include the distributions of major filamentary USM structures as observed by Kalberla et al. (2016; their Fig. 12). On the right hand side the XNM components are also included for comparison.
Current usage metrics show cumulative count of Article Views (full-text article views including HTML views, PDF and ePub downloads, according to the available data) and Abstracts Views on Vision4Press platform.
Data correspond to usage on the plateform after 2015. The current usage metrics is available 48-96 hours after online publication and is updated daily on week days.
Initial download of the metrics may take a while.