Fig. 10
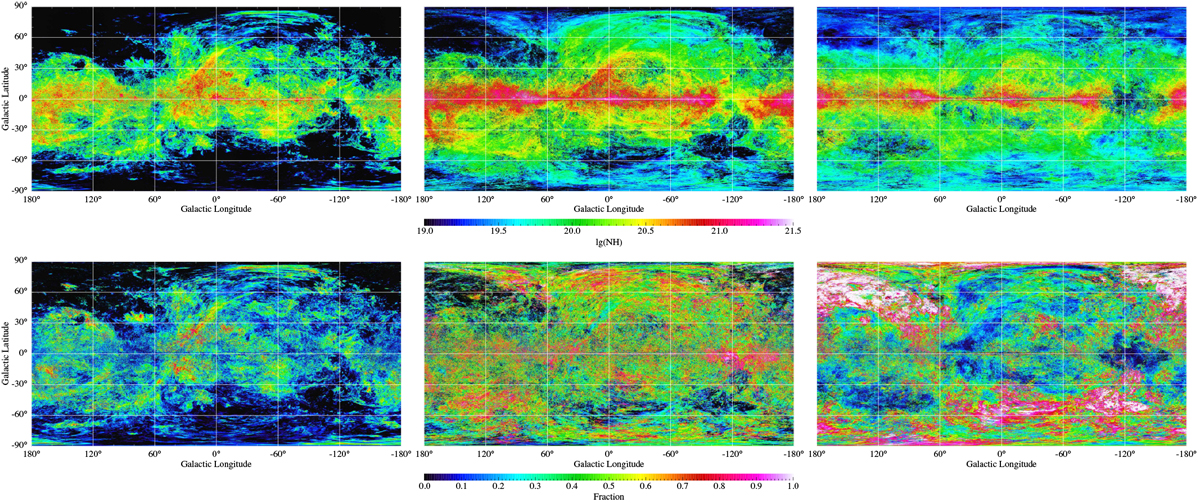
Top panel: All-sky display of the observed H I column density distributions, integrating over a velocity range − 8 < vLSR < 8 km s−1 and distinguishing contributions from the CNM (left), LNM (middle), and WNM (right). The color scale is logarithmic, lg (NH ∕[cm−2]). Bottom panel: H I phase fractions fCNM (left), fLNM (middle), and fWNM (right) for the same data. Galactic coordinates are used, the Galactic Center is in the middle.
Current usage metrics show cumulative count of Article Views (full-text article views including HTML views, PDF and ePub downloads, according to the available data) and Abstracts Views on Vision4Press platform.
Data correspond to usage on the plateform after 2015. The current usage metrics is available 48-96 hours after online publication and is updated daily on week days.
Initial download of the metrics may take a while.