Fig. 9.
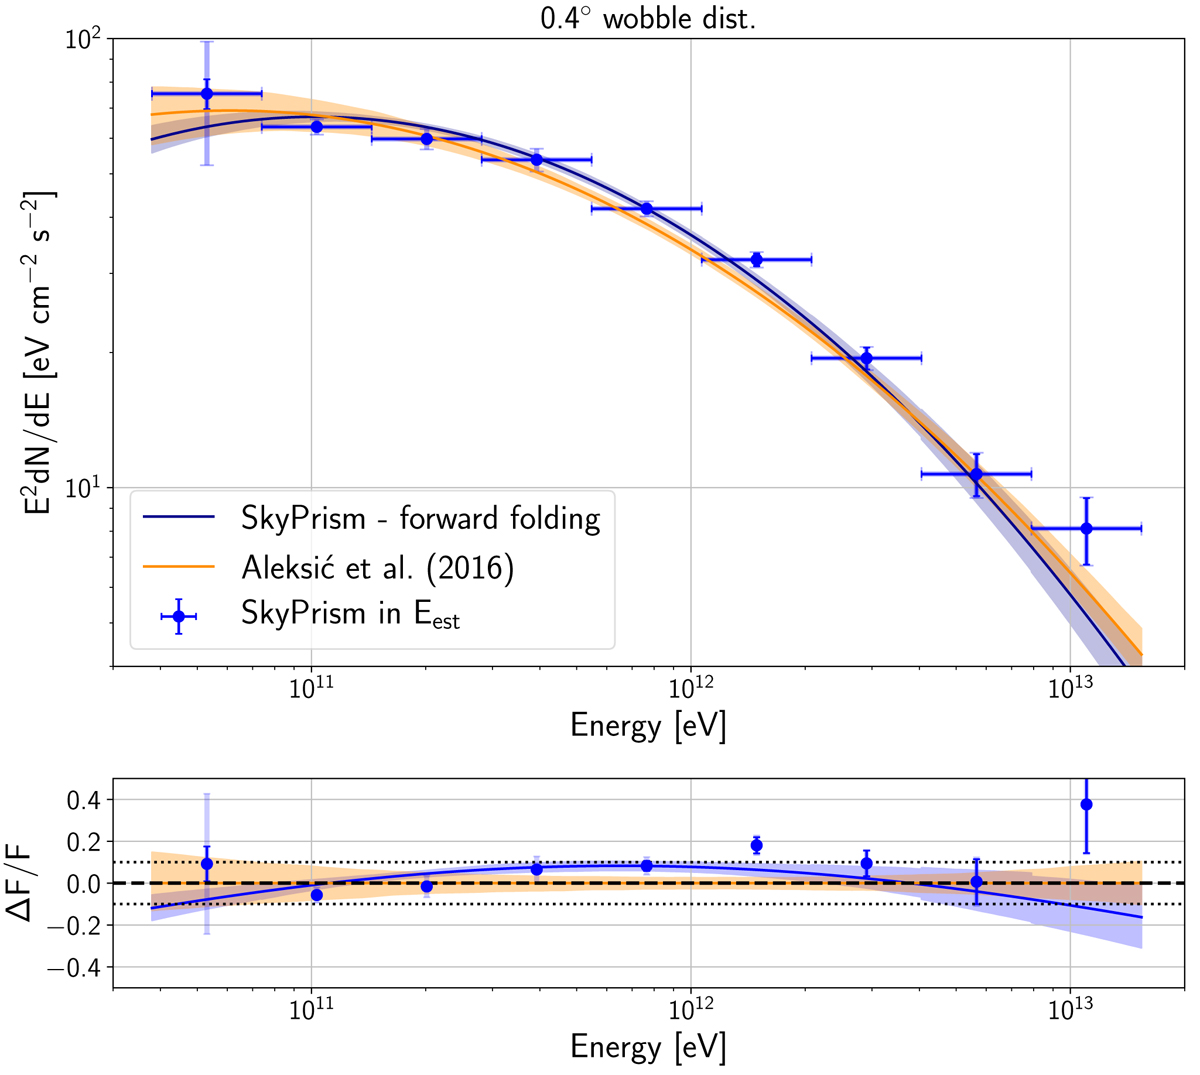
SED of the Crab Nebula obtained by processing the data set used by Aleksić et al. (2016b) with the full SkyPrism tool chain. The spectral fit is obtained via the forward folding procedure, whereas the data points are the results of the individual fits in each Eest bin. The dark blue error bars of the data points are the statistical error, and the light blue error bars indicate the uncertainties from the exposure model. The obtained results are also compared to the Crab Nebula SED from the same publication in terms of the relative flux difference (ΔF/F.)
Current usage metrics show cumulative count of Article Views (full-text article views including HTML views, PDF and ePub downloads, according to the available data) and Abstracts Views on Vision4Press platform.
Data correspond to usage on the plateform after 2015. The current usage metrics is available 48-96 hours after online publication and is updated daily on week days.
Initial download of the metrics may take a while.