Free Access
Fig. 8.
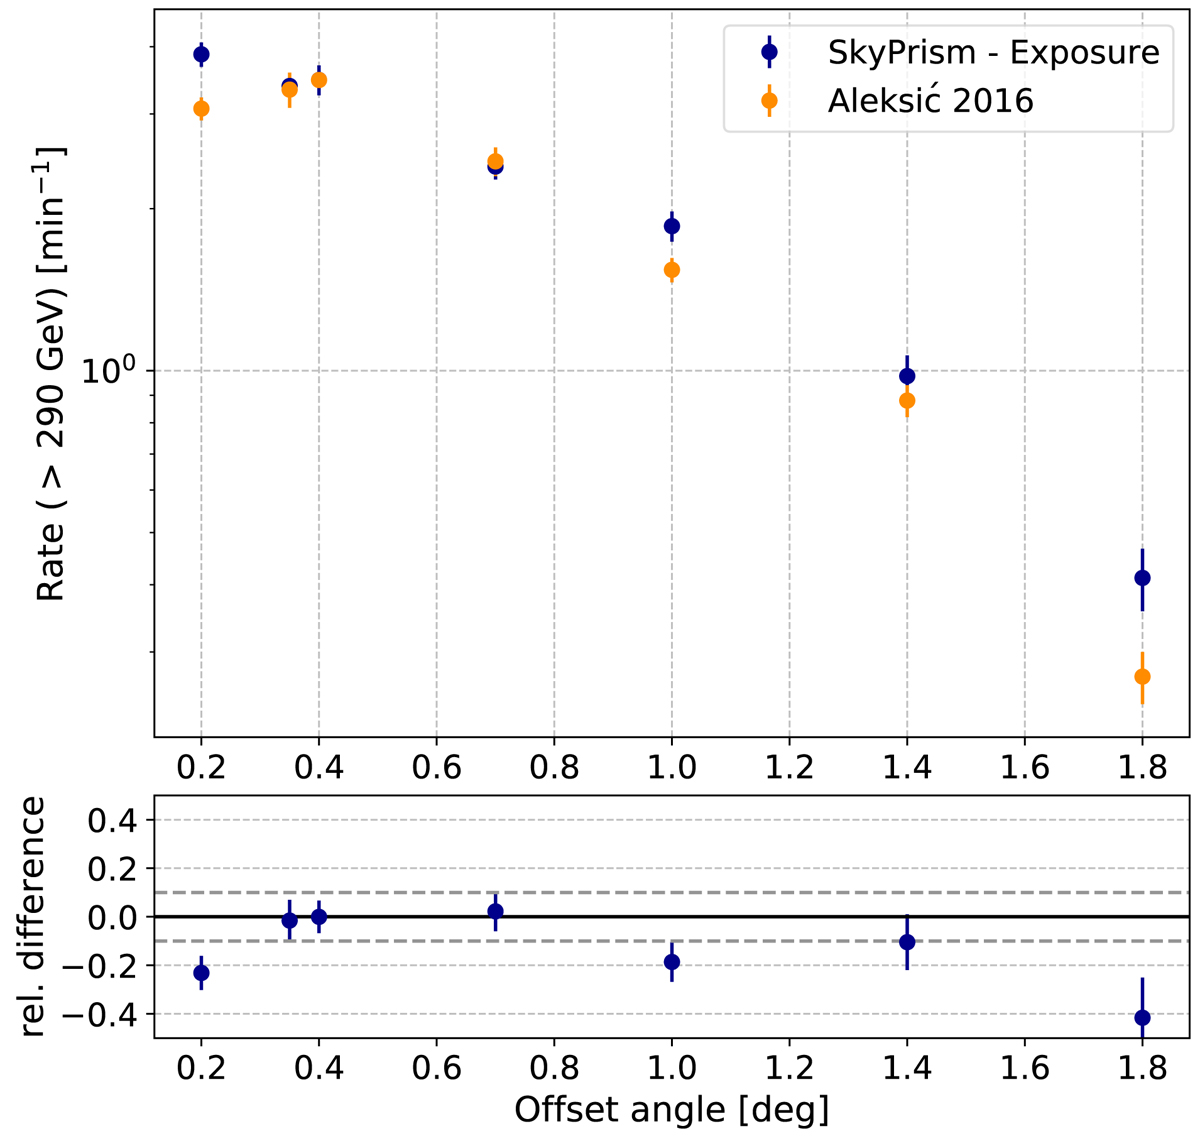
Crab Nebula count rate as a function of the off-axis angle. Orange points correspond to Aleksić et al. (2016b), and the blue points denote the estimates from the SkyPrism exposure model, obtained for the same data and selection cuts. Bottom panel: the relative difference between the two data sets at each offset angle.
Current usage metrics show cumulative count of Article Views (full-text article views including HTML views, PDF and ePub downloads, according to the available data) and Abstracts Views on Vision4Press platform.
Data correspond to usage on the plateform after 2015. The current usage metrics is available 48-96 hours after online publication and is updated daily on week days.
Initial download of the metrics may take a while.