Fig. 3.
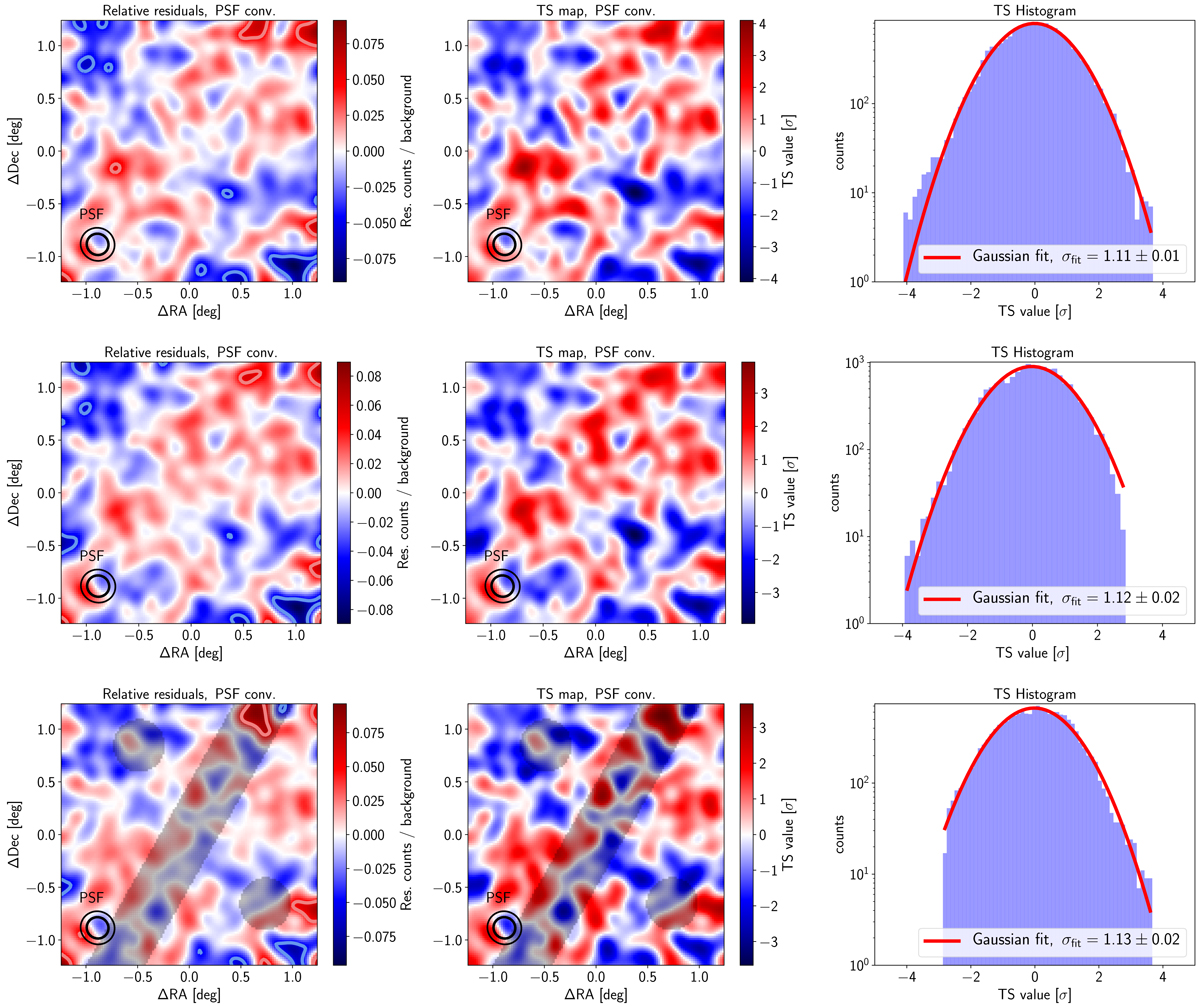
Background methods tested with an empty sky region at Zd < 35°. Top to bottom panels: Wobble map, blind map, and excluded region map. For the excluded region map, the ignored regions (a stripe and two circles) are shaded. The PSF after convolution with a smoothing kernel is depicted in terms of 39% and 68% containment contours. Left panels: ratio of the residuals (skymap-reconstructed background) to the skymap. The blue and red contours indicate ±5% relative flux boundary. Centre panels: test statistic maps computed for the residual counts in the left panels. Right panels: distribution of the test statistic values (blue histogram) compared to the expected normal distribution (red curve). See Sects. 2.3 and 3.1 for details.
Current usage metrics show cumulative count of Article Views (full-text article views including HTML views, PDF and ePub downloads, according to the available data) and Abstracts Views on Vision4Press platform.
Data correspond to usage on the plateform after 2015. The current usage metrics is available 48-96 hours after online publication and is updated daily on week days.
Initial download of the metrics may take a while.