Fig. 9.
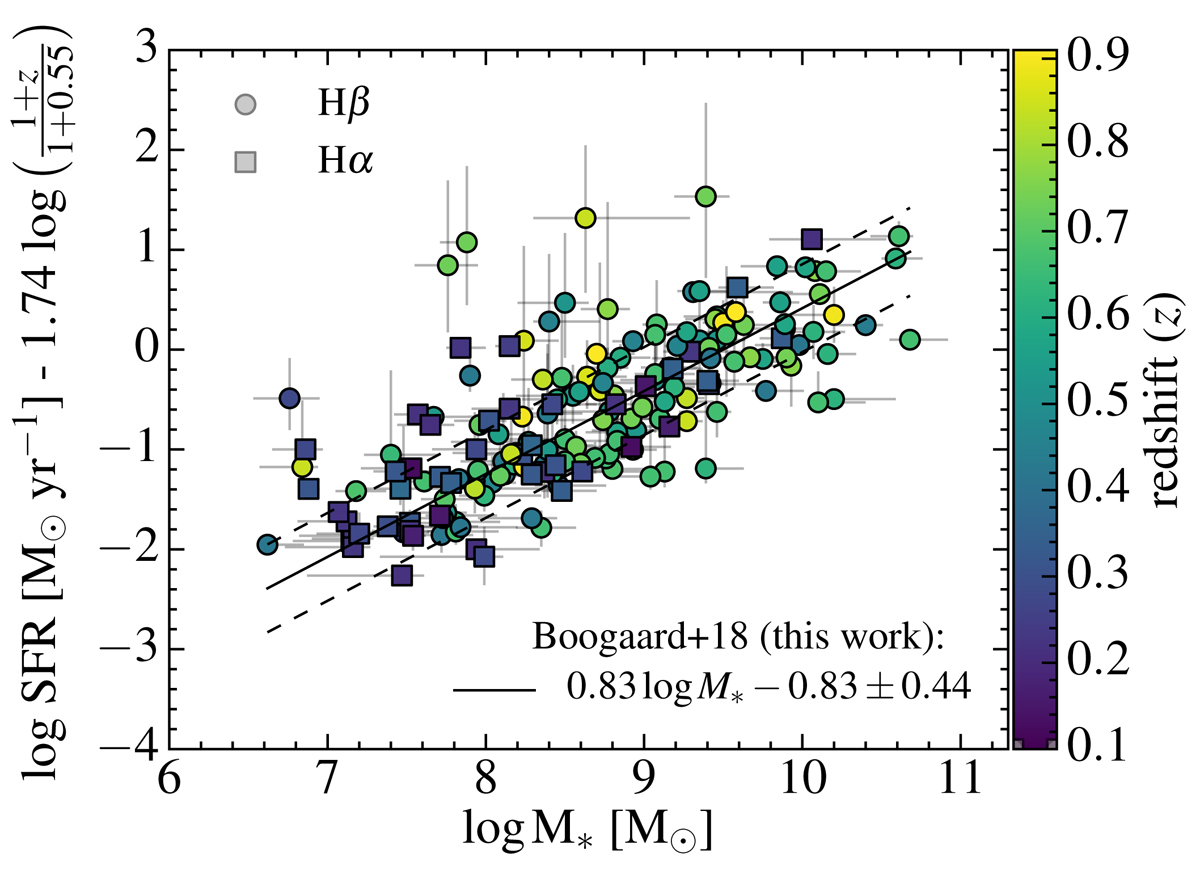
The best-fit star formation sequence for the 179 star-forming galaxies observed with MUSE. The symbols indicate the dust-corrected tracer used to infer the SFR. The solid line shows best-fit relation, as presented in Eq. (11), and the dashed lines show the 1σ intrinsic scatter. We subtract the evolution from the y-axis and scale to the average redshift of the sample; z = 0.55. After accounting for evolution, the galaxies clearly follow the star formation sequence, down to the lowest masses and SFRs. The slightly larger fraction of galaxies that scatter into the high-mass, low-SFR regime may be a result of the flattening of the relation above M* = 1010 M⊙.
Current usage metrics show cumulative count of Article Views (full-text article views including HTML views, PDF and ePub downloads, according to the available data) and Abstracts Views on Vision4Press platform.
Data correspond to usage on the plateform after 2015. The current usage metrics is available 48-96 hours after online publication and is updated daily on week days.
Initial download of the metrics may take a while.