Fig. 8.
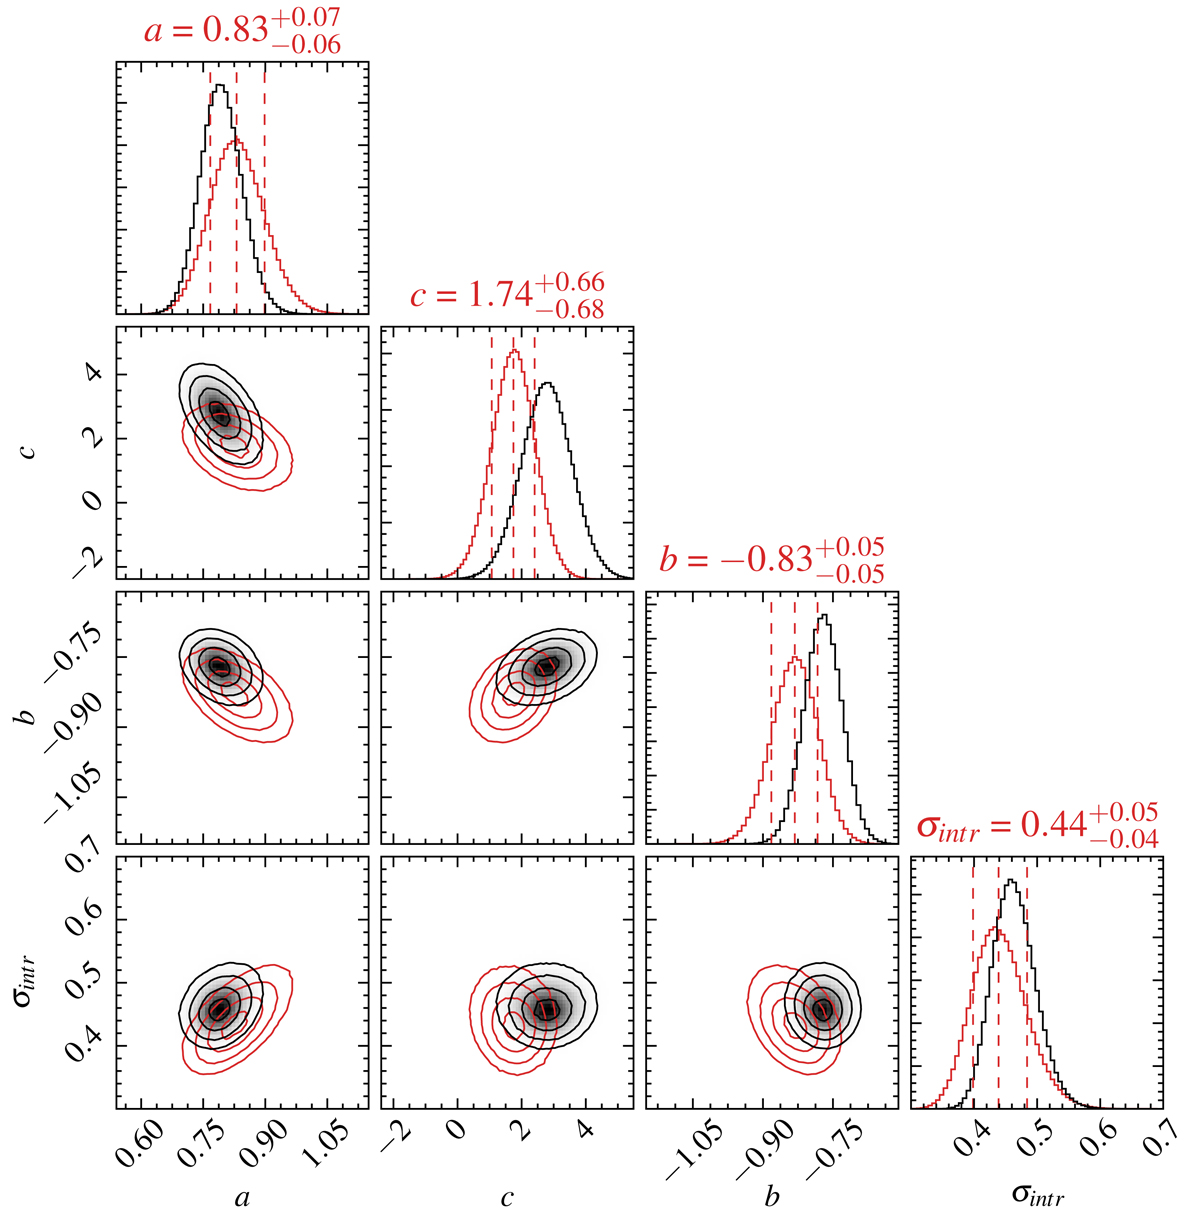
Projections of the 4D posterior distribution for the model parameters: slope (a), evolution (c), normalisation (b) and intrinsic scatter (σintr). The histograms on top show the marginalised distributions of the model parameters. The bias-corrected posterior median value and the 16th and 84th percentile are denoted by the dashed lines and by the values above the histograms. The contours show the 0.5, 1, 1.5 and 2σ levels. The posterior directly from the modelling is shown in black, red indicates the posterior after applying the bias correction (Eq. (A.3)). Figure created using the corner.py module (Foreman-Mackey 2016).
Current usage metrics show cumulative count of Article Views (full-text article views including HTML views, PDF and ePub downloads, according to the available data) and Abstracts Views on Vision4Press platform.
Data correspond to usage on the plateform after 2015. The current usage metrics is available 48-96 hours after online publication and is updated daily on week days.
Initial download of the metrics may take a while.