Fig. 7.
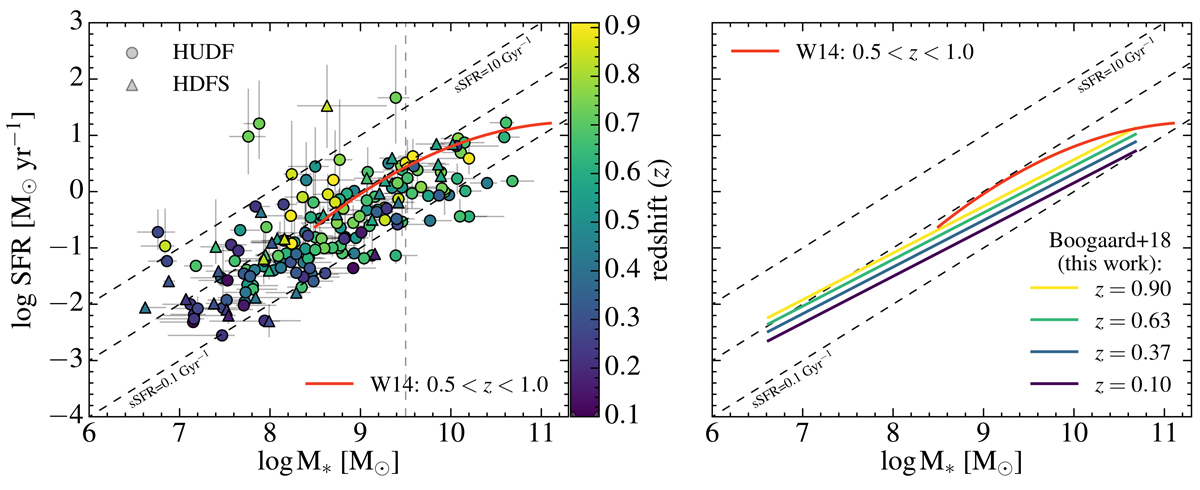
Left panel: sample of 179 star-forming galaxies observed with MUSE, plotted on the M*-SFR plane. The symbols indicate the field and colour indicates the redshift. The dashed lines show a constant sSFR, which is equivalent to a linear relationship: SFR ∝ M*. The red curve shows the model of the star formation sequence from Whitaker et al. (2014) for 0.5 < z < 1.0. The vertical grey dashed line indicates the selection for the low-mass fit (Sect. 5.2). Right panel: same as the left panel but with the data points removed, showing (the evolution of) the star formation sequence as seen by MUSE, according to Eq. (11).
Current usage metrics show cumulative count of Article Views (full-text article views including HTML views, PDF and ePub downloads, according to the available data) and Abstracts Views on Vision4Press platform.
Data correspond to usage on the plateform after 2015. The current usage metrics is available 48-96 hours after online publication and is updated daily on week days.
Initial download of the metrics may take a while.