Fig. 6.
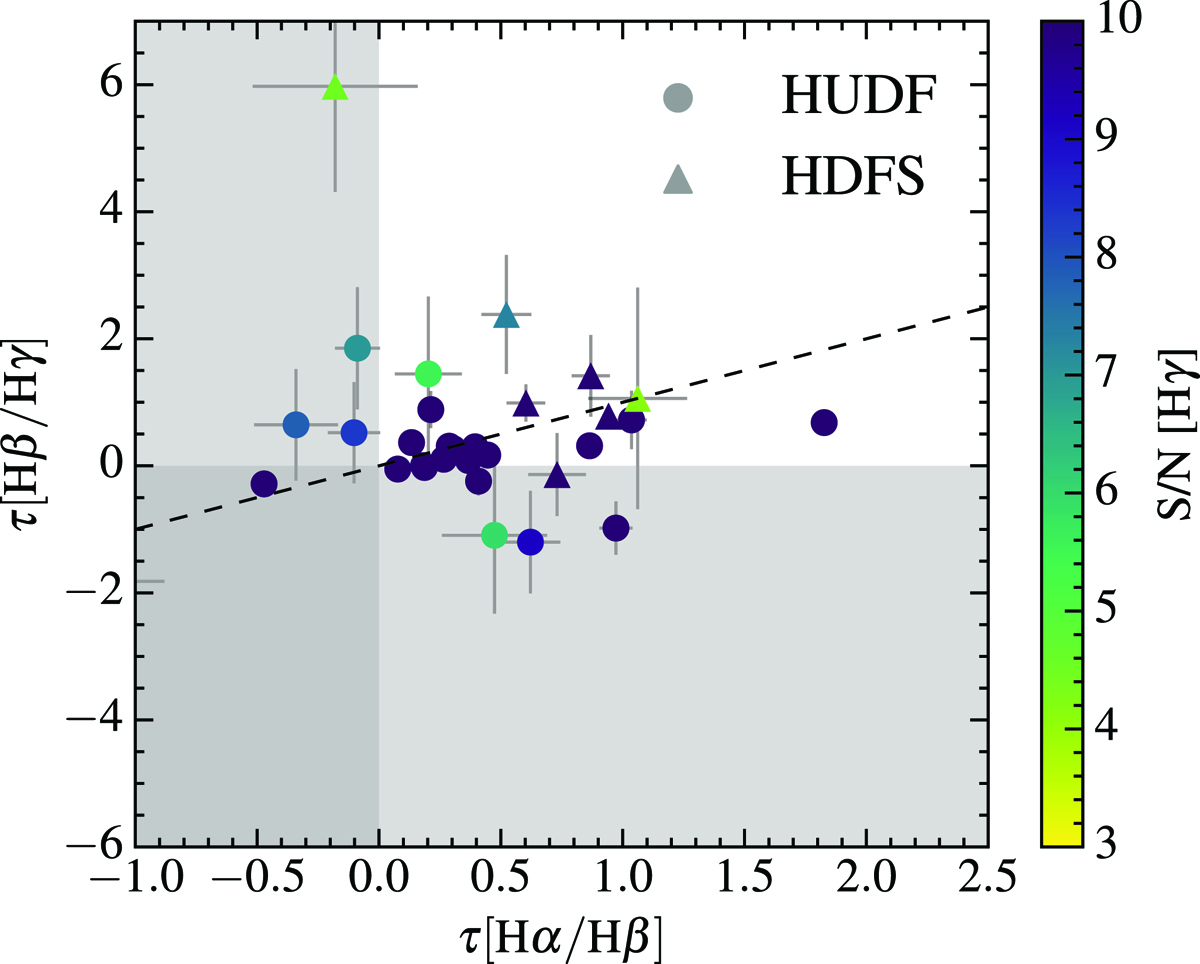
Optical depths at the wavelength of Hβ λ4861 as derived from both the Hβ λ4861/Hγ λ4340 and the Hα λ6563/Hβ λ4861-ratio, coloured by Hγ λ4340 signal-to-noise (S/N). The dashed line is the one-to-one relation. Overall the optical depths agree reasonably well, unless the Hγ S/N is low. Most galaxies actually show little dust (τ close to zero). The shaded area shows the regions of (unphysical) negative optical depth for each axis. We set the optical depth to zero for galaxies with negative τ as this is often consistent with the error bars and the offset is due to noise in the spectra. We note that some of the high-S/N outliers actually have discrepant Balmer ratios. If the inferred optical depth is very different, this will affect the comparison of the dust-corrected SFR from Hβ λ4861 and Hα λ6563 (see Fig. 5).
Current usage metrics show cumulative count of Article Views (full-text article views including HTML views, PDF and ePub downloads, according to the available data) and Abstracts Views on Vision4Press platform.
Data correspond to usage on the plateform after 2015. The current usage metrics is available 48-96 hours after online publication and is updated daily on week days.
Initial download of the metrics may take a while.