Fig. 2.
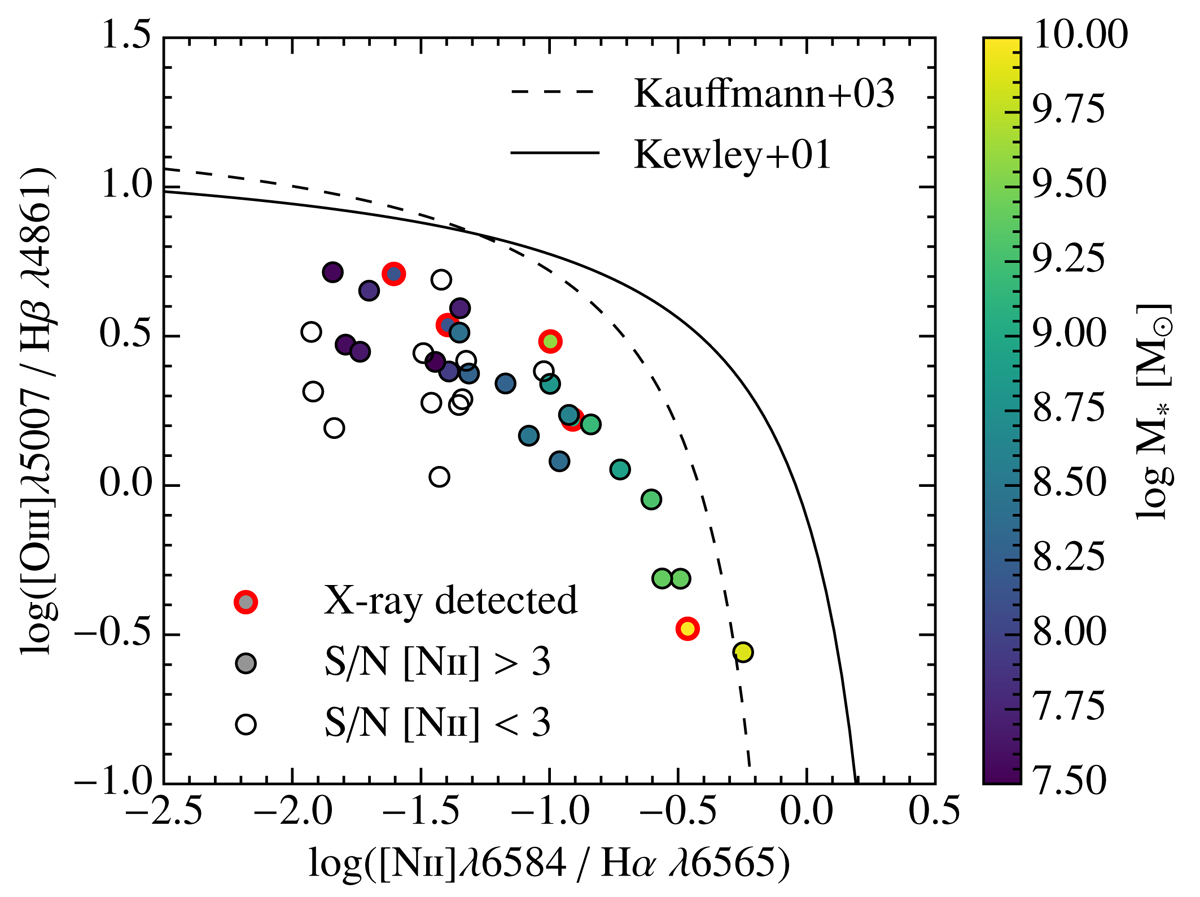
BPT-diagram (Baldwin et al. 1981) of the sources in our Hα λ6563-subsample for which we measure [N II] λ6584. All galaxies fall in the star-forming region of the diagram. The filled and open circles have S/N([N II] λ6584) > 3 and < 3, respectively, and the 5 sources encircled in red are detected in X-rays (Luo et al. 2016). The solid and dashed curve show the AGN boundary and maximum starburst line from Kauffmann et al. (2003) and Kewley et al. (2001), respectively.
Current usage metrics show cumulative count of Article Views (full-text article views including HTML views, PDF and ePub downloads, according to the available data) and Abstracts Views on Vision4Press platform.
Data correspond to usage on the plateform after 2015. The current usage metrics is available 48-96 hours after online publication and is updated daily on week days.
Initial download of the metrics may take a while.