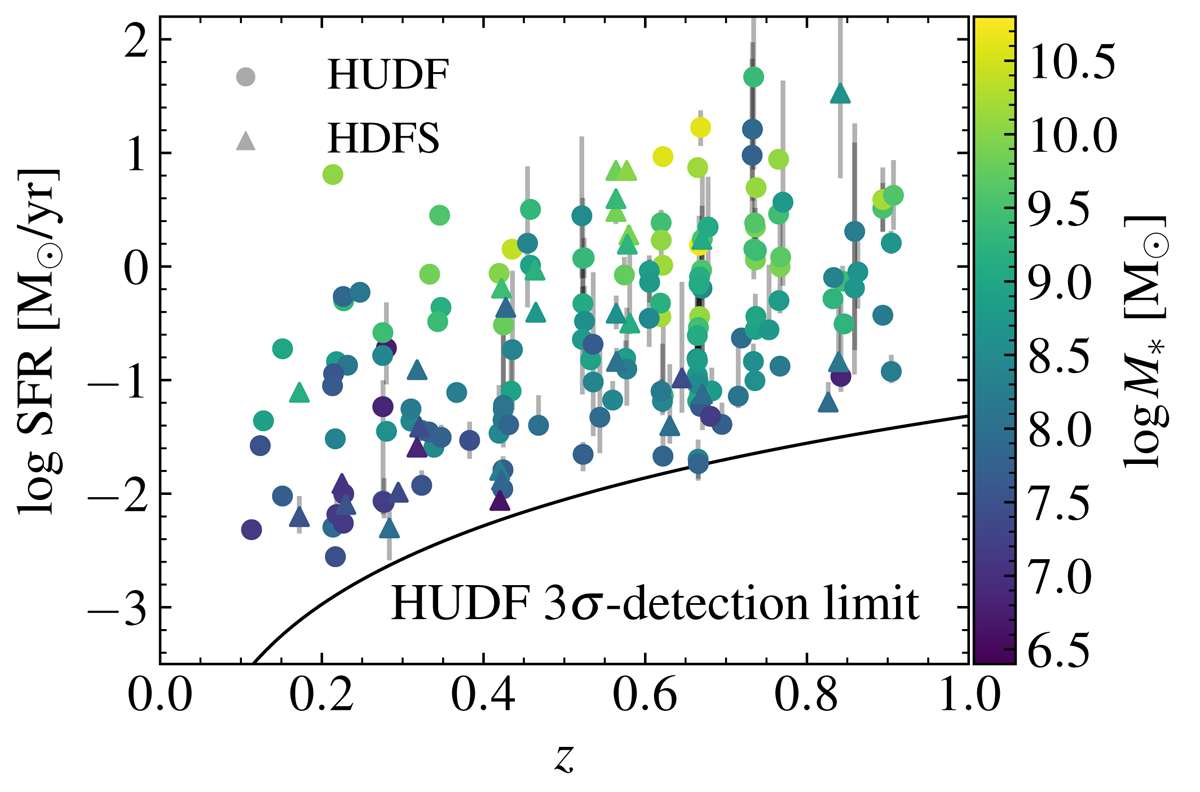
Fig. 1.

Redshift distribution of our galaxies plotted against their (dust-corrected) SFR (1σ error bars are in grey). The colour denotes the stellar mass. The solid line depicts the lowest uncorrected SFR from Hβ λ4861 we can detect in the HUDF at each redshift (which is effectively determined by the requirement that S/N(Hγ λ4340)> 3; see Sect. 2.4).
Current usage metrics show cumulative count of Article Views (full-text article views including HTML views, PDF and ePub downloads, according to the available data) and Abstracts Views on Vision4Press platform.
Data correspond to usage on the plateform after 2015. The current usage metrics is available 48-96 hours after online publication and is updated daily on week days.
Initial download of the metrics may take a while.


