Fig. 7.
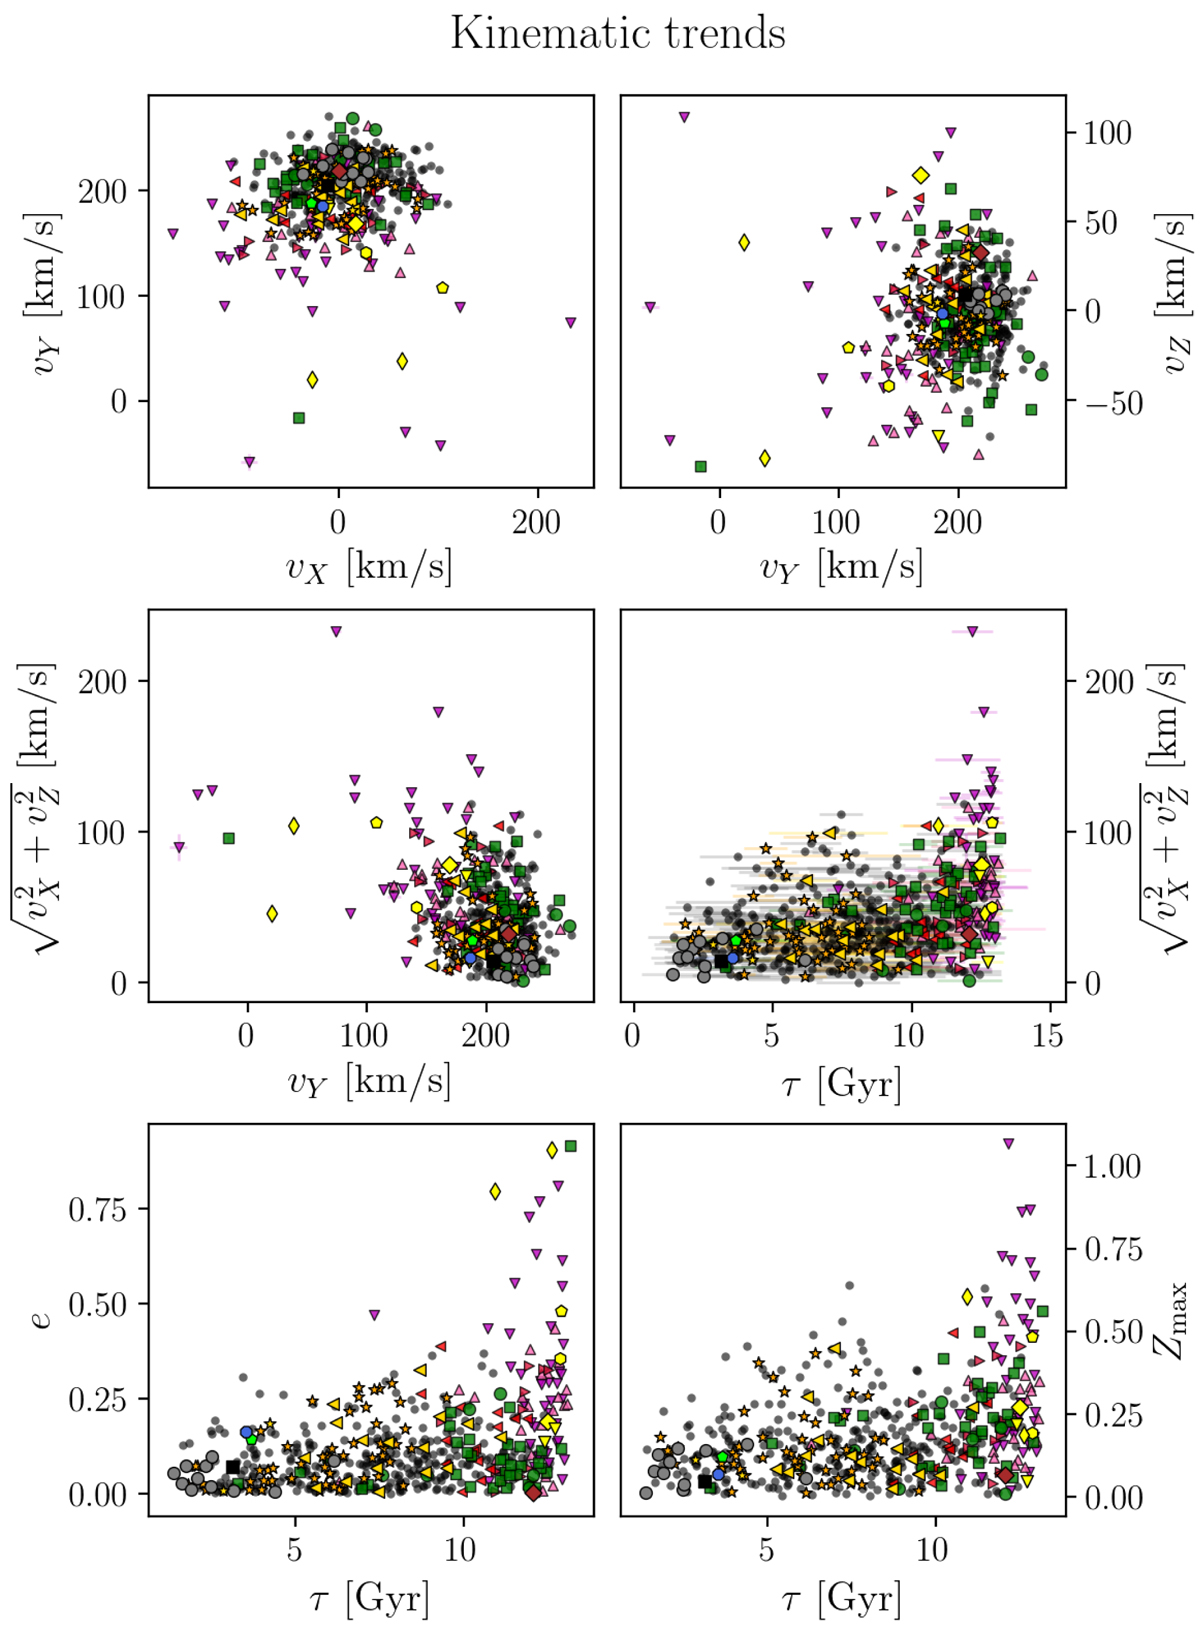
Kinematic trends of the HARPS-GTO sample. The upper panels show the distribution of the sample in the v X − v Y (or U V) and v Y − v Z (V W) planes. We note that the 1σ errorbars are in most cases smaller than the symbols. The middle left panel shows the classic Toomre diagram (e.g. Feltzing et al. 2003), and the middle right panel shows a diagram of orbital heating (as measured by v X and v − Z) as a function of age. The bottom panels display the orbital eccentricities and maximum heights above the Galactic plane, respectively, as a function of age.
Current usage metrics show cumulative count of Article Views (full-text article views including HTML views, PDF and ePub downloads, according to the available data) and Abstracts Views on Vision4Press platform.
Data correspond to usage on the plateform after 2015. The current usage metrics is available 48-96 hours after online publication and is updated daily on week days.
Initial download of the metrics may take a while.