Fig. 5.
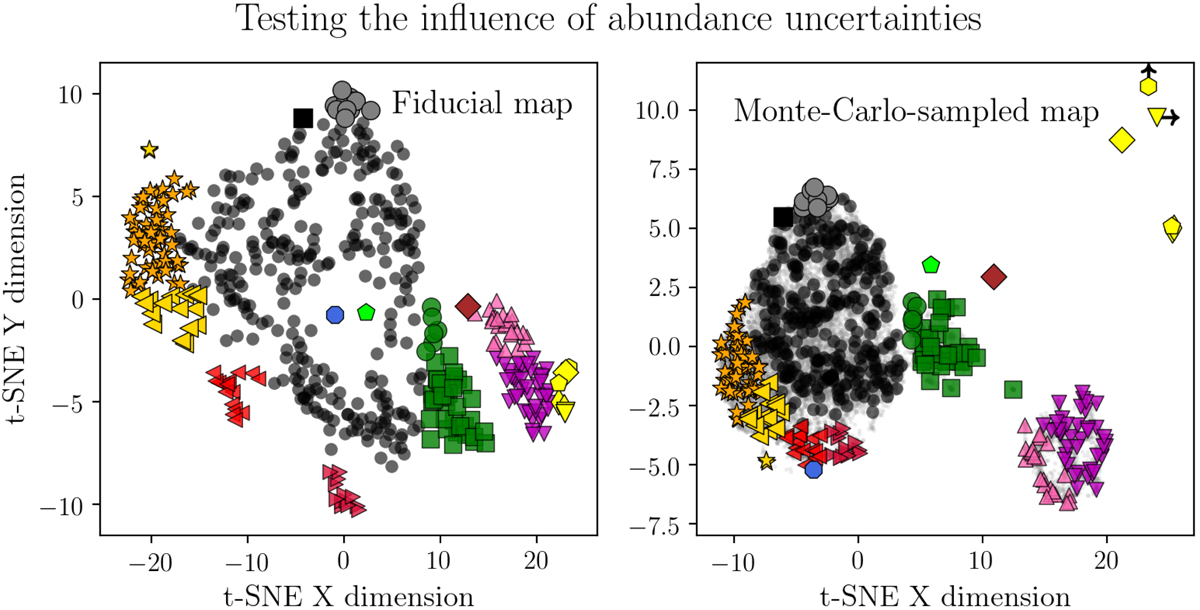
Robustness test of our t-SNE-selected subsamples to abundance errors. The left panel shows the fiducial map, while the right panel shows the result of our Monte-Carlo test. For each star, 50 random stars were drawn from a Gaussian centred on the measured abundance, and with dispersions corresponding to the measured uncertainties. t-SNE was then run on this artificially increased sample. The resulting map (for p = 40) shows the positions of each Monte-Carlo realisation as faint grey dots, and the median position of each star as the same big symbol as in the fiducial map. The experiment demonstrates that most of our selected subgroups are robust to doubling the observational errors of the HARPS sample.
Current usage metrics show cumulative count of Article Views (full-text article views including HTML views, PDF and ePub downloads, according to the available data) and Abstracts Views on Vision4Press platform.
Data correspond to usage on the plateform after 2015. The current usage metrics is available 48-96 hours after online publication and is updated daily on week days.
Initial download of the metrics may take a while.