Fig. 4.
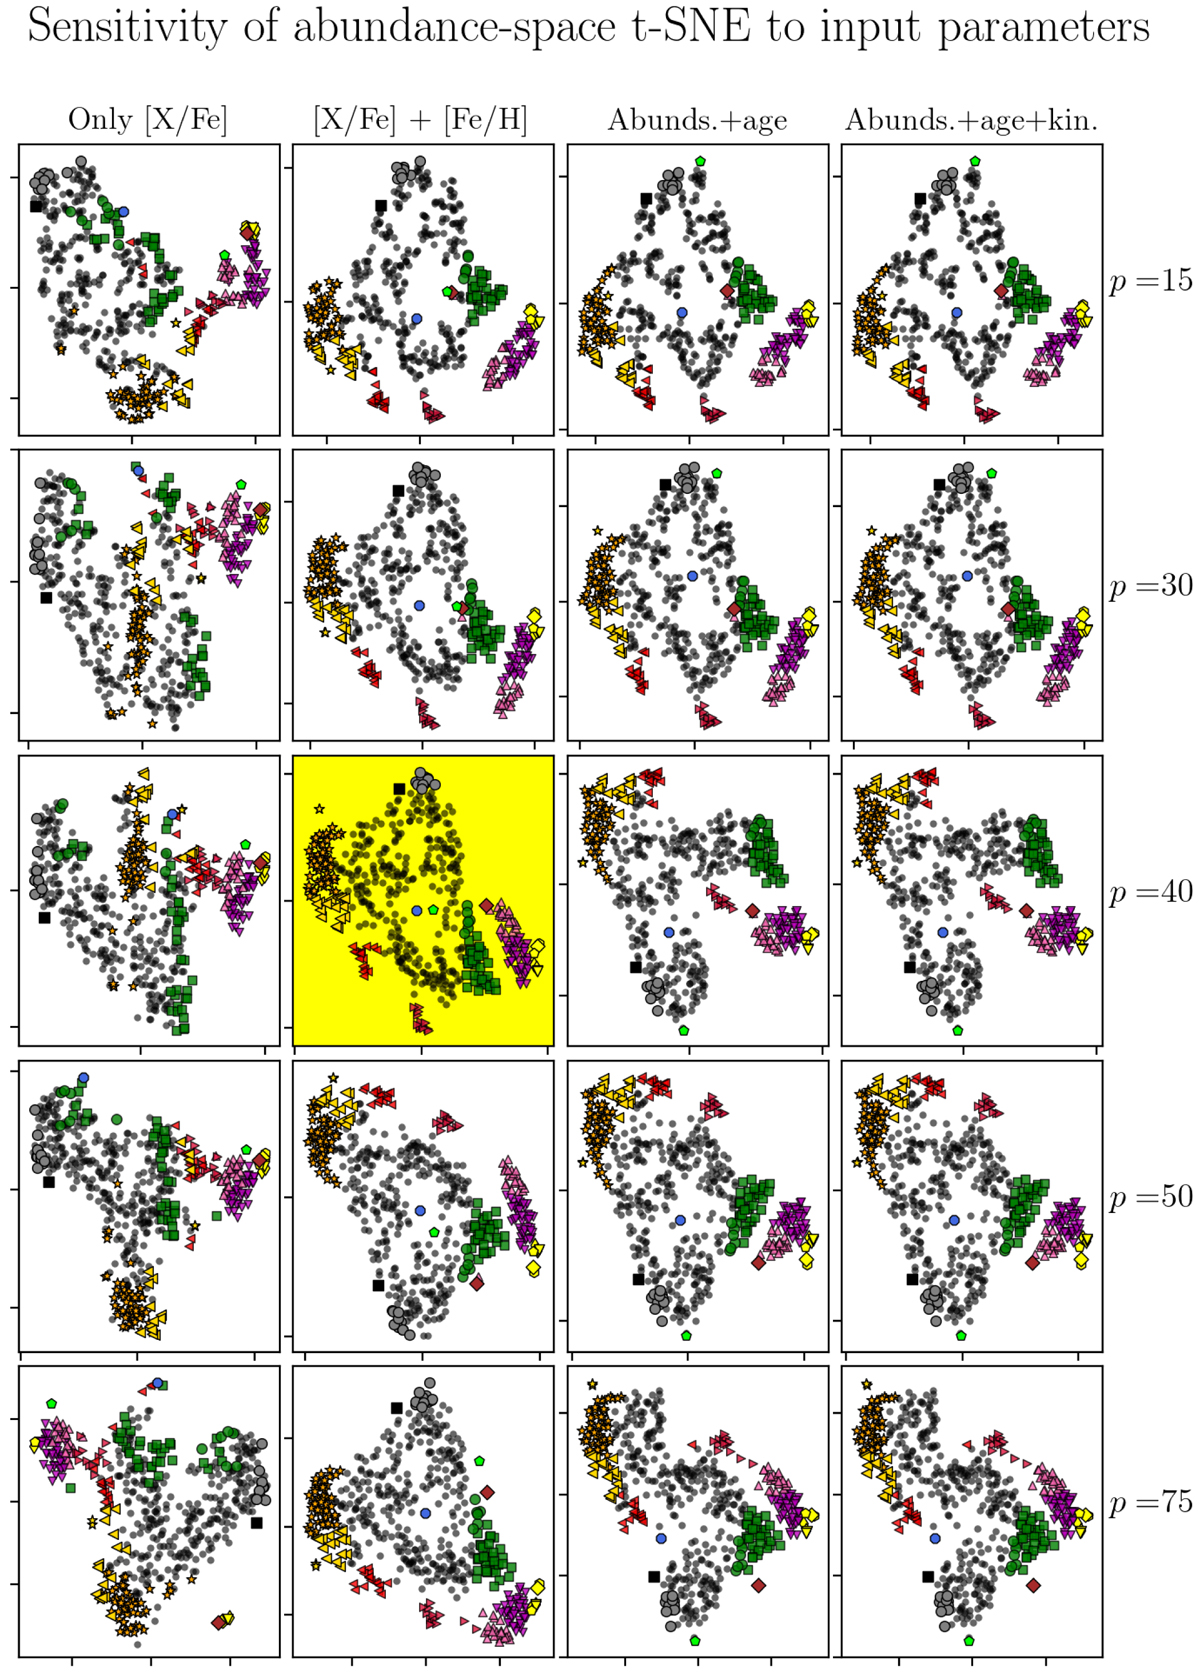
t-SNE representations of the chrono-chemo-kinematics space spanned by the Delgado Mena et al. (2017) sample. Each column represents a combination of input information (only [X/Fe], [X/Fe] + [Fe/H], [X/Fe] + [Fe/H] + age, and [X/Fe] + [Fe/H] + age + space velocities, respectively), while each row corresponds to a particular perplexity value, as indicated on the right side of the figure. The panel highlighted in yellow represents the results that we analyse in detail in this paper by defining chemical sub-populations based on this map.
Current usage metrics show cumulative count of Article Views (full-text article views including HTML views, PDF and ePub downloads, according to the available data) and Abstracts Views on Vision4Press platform.
Data correspond to usage on the plateform after 2015. The current usage metrics is available 48-96 hours after online publication and is updated daily on week days.
Initial download of the metrics may take a while.