Fig. 3.
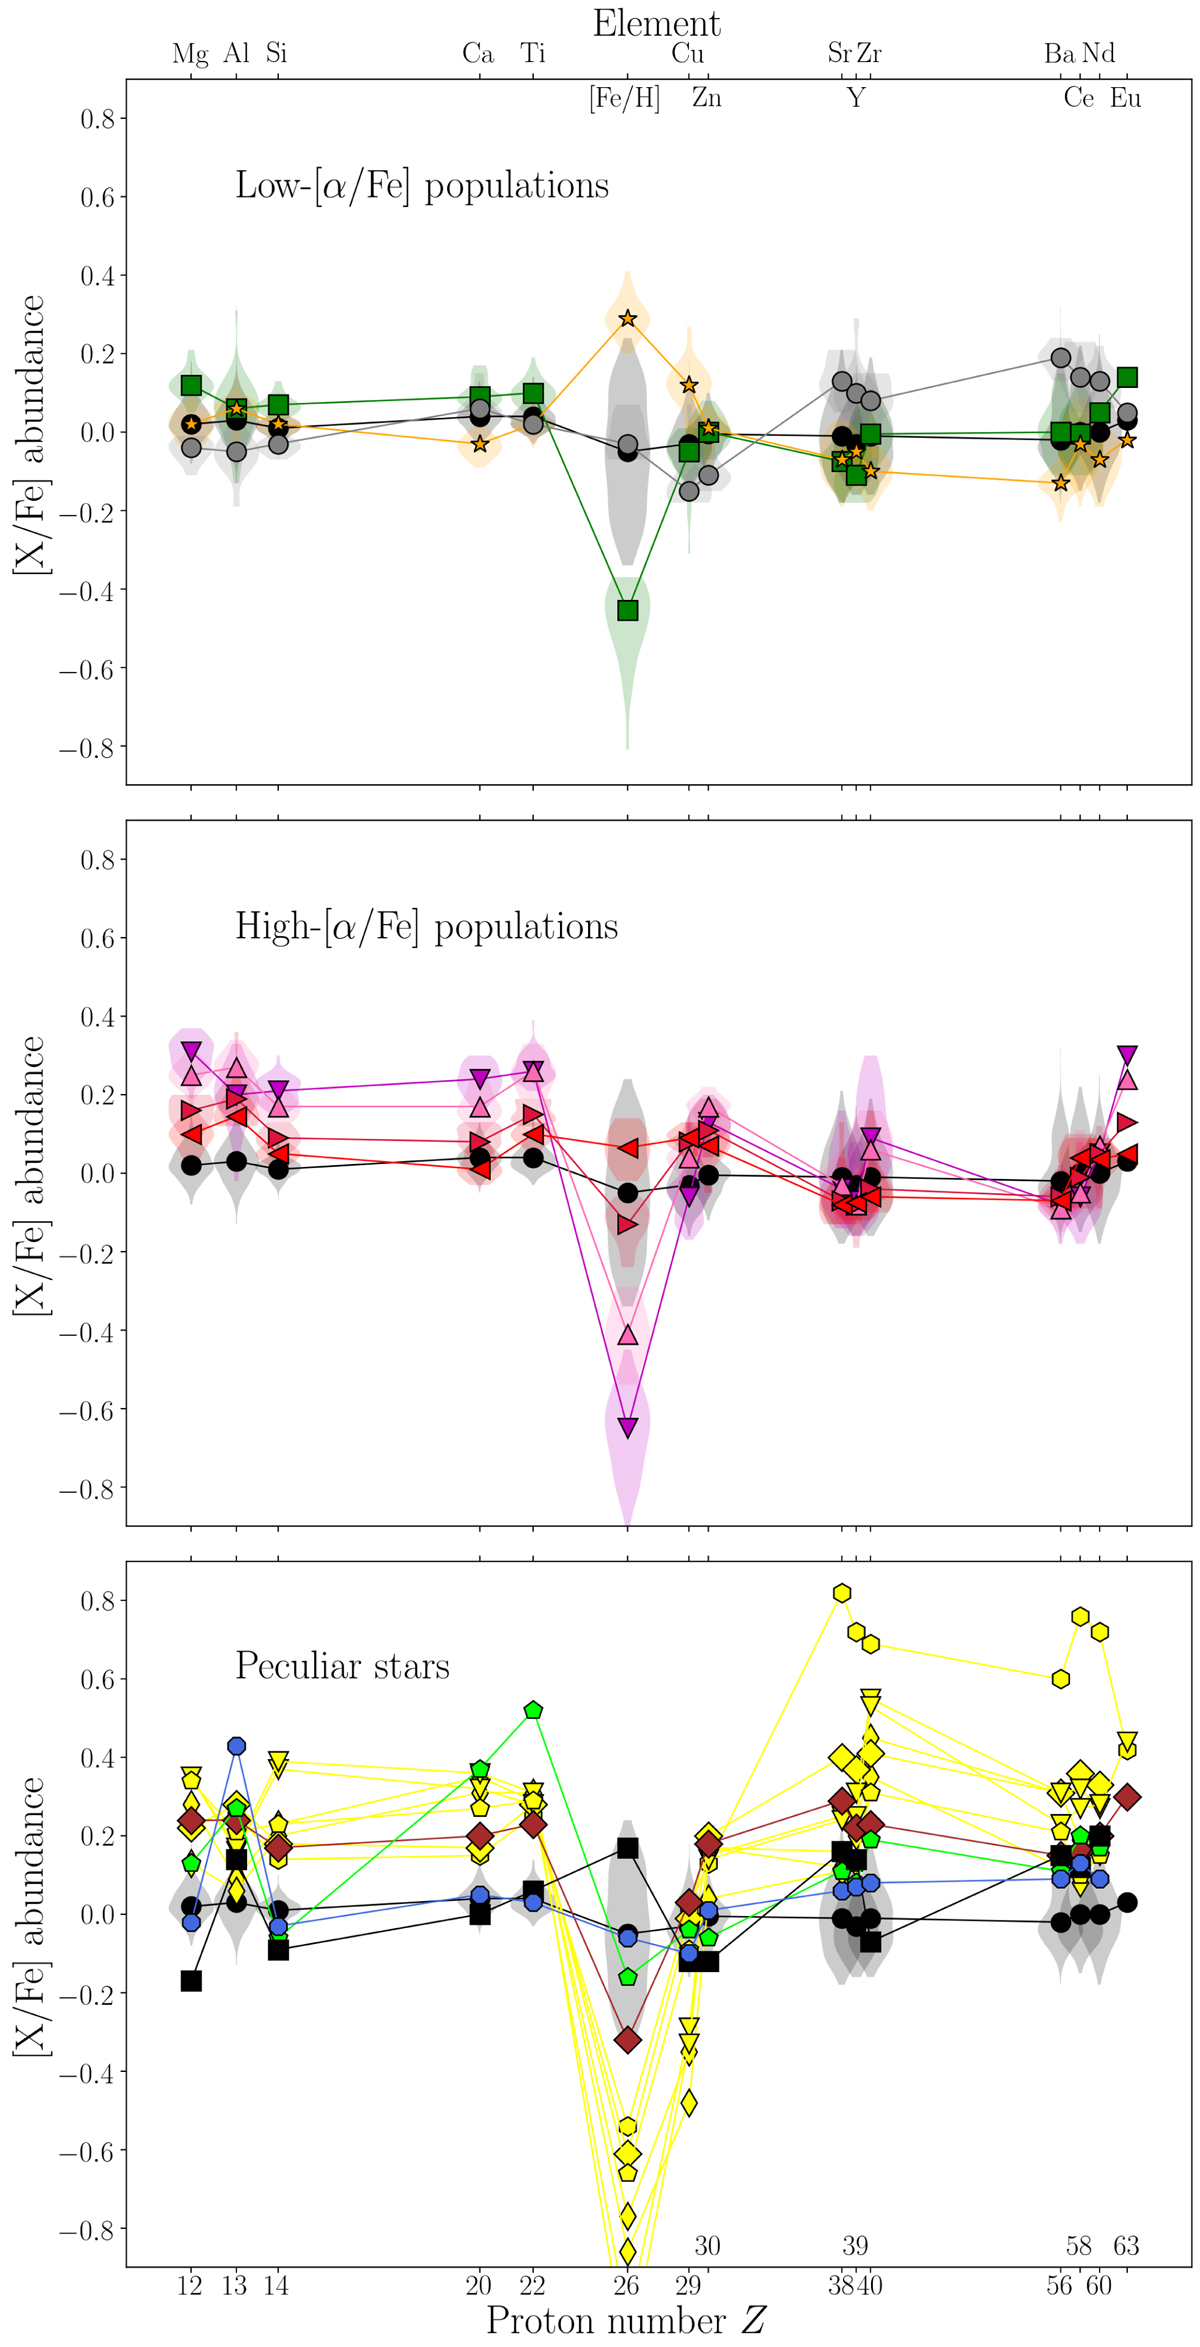
Chemical-abundance patterns relative to iron for the t-SNE-selected subsamples of the HARPS survey, using the same symbols and colours as in Fig. 1. For each population we show the median abundance trend, as well as the full abundance distribution (for the top two panels). For visibility, we divided the sample into three groups that are shown separately in the three panels. The “thin disc” population (black circles) is shown in all panels for comparison.
Current usage metrics show cumulative count of Article Views (full-text article views including HTML views, PDF and ePub downloads, according to the available data) and Abstracts Views on Vision4Press platform.
Data correspond to usage on the plateform after 2015. The current usage metrics is available 48-96 hours after online publication and is updated daily on week days.
Initial download of the metrics may take a while.