Fig. 2.
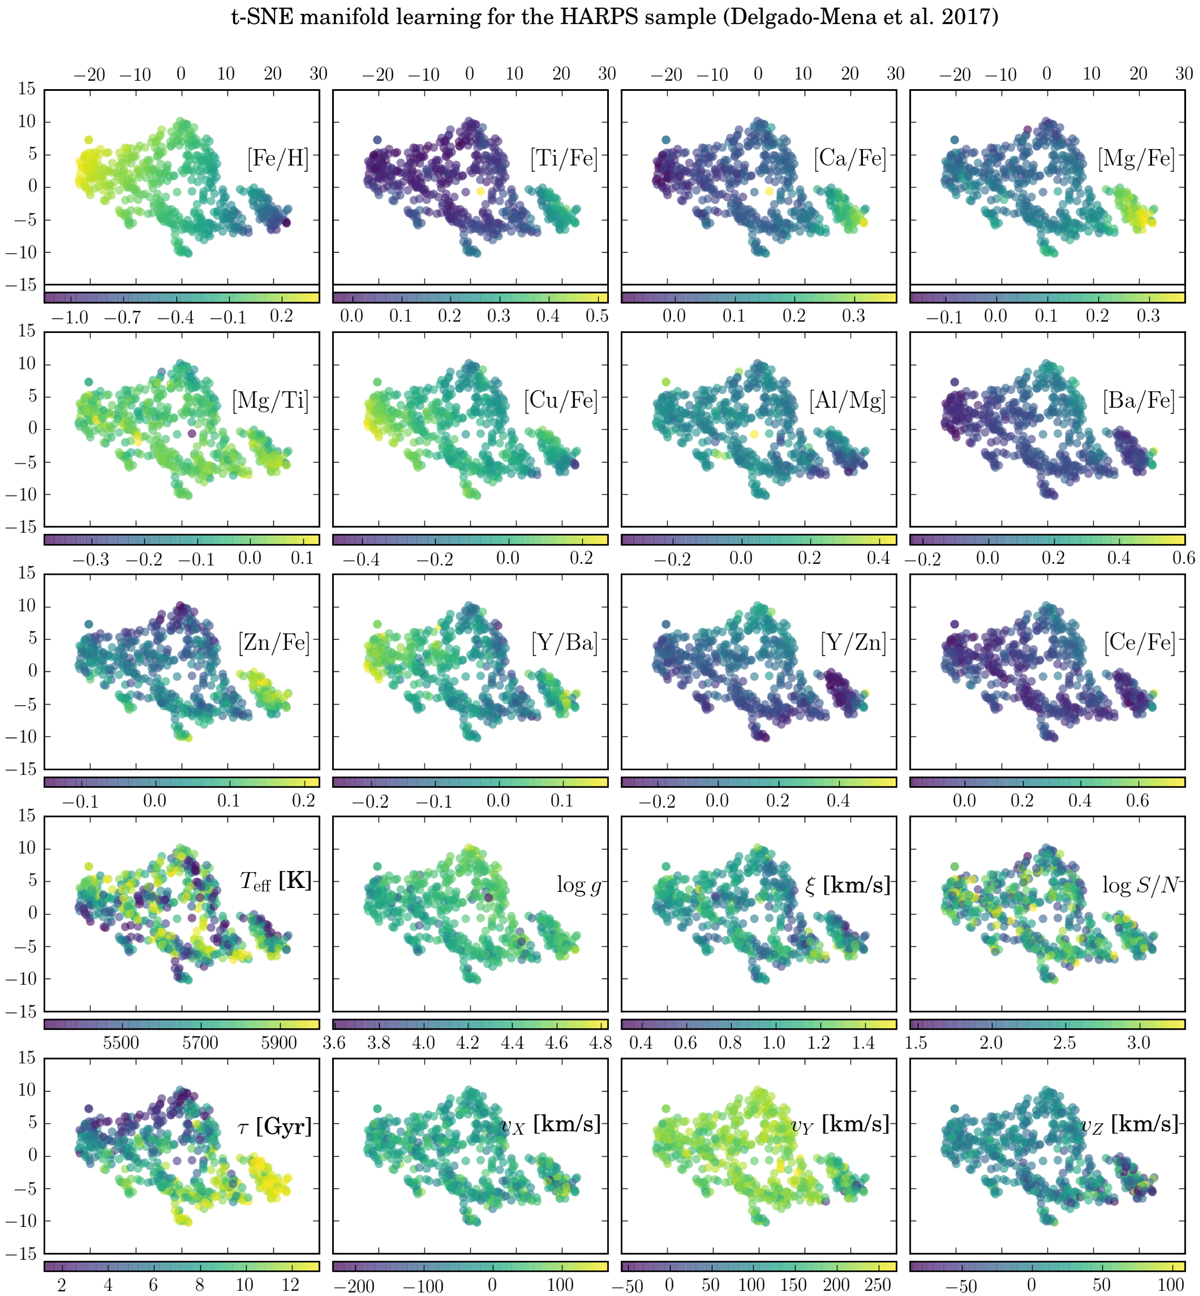
Fiducial t-SNE projection of the Delgado Mena et al. (2017) sample (see big panel in Fig. 1), colour-coded by chemical abundances (top three rows), spectroscopic parameters (effective temperature T eff, surface gravity logg, microturbulence ξ, and signal-to-noise ratio logS/N; fourth row), age τ (fifth row, first panel) and space velocities (fifth row). We note that only [Fe/H] and the [X/Fe] ratios were used as input for the t-SNE run.
Current usage metrics show cumulative count of Article Views (full-text article views including HTML views, PDF and ePub downloads, according to the available data) and Abstracts Views on Vision4Press platform.
Data correspond to usage on the plateform after 2015. The current usage metrics is available 48-96 hours after online publication and is updated daily on week days.
Initial download of the metrics may take a while.