Fig. 1.
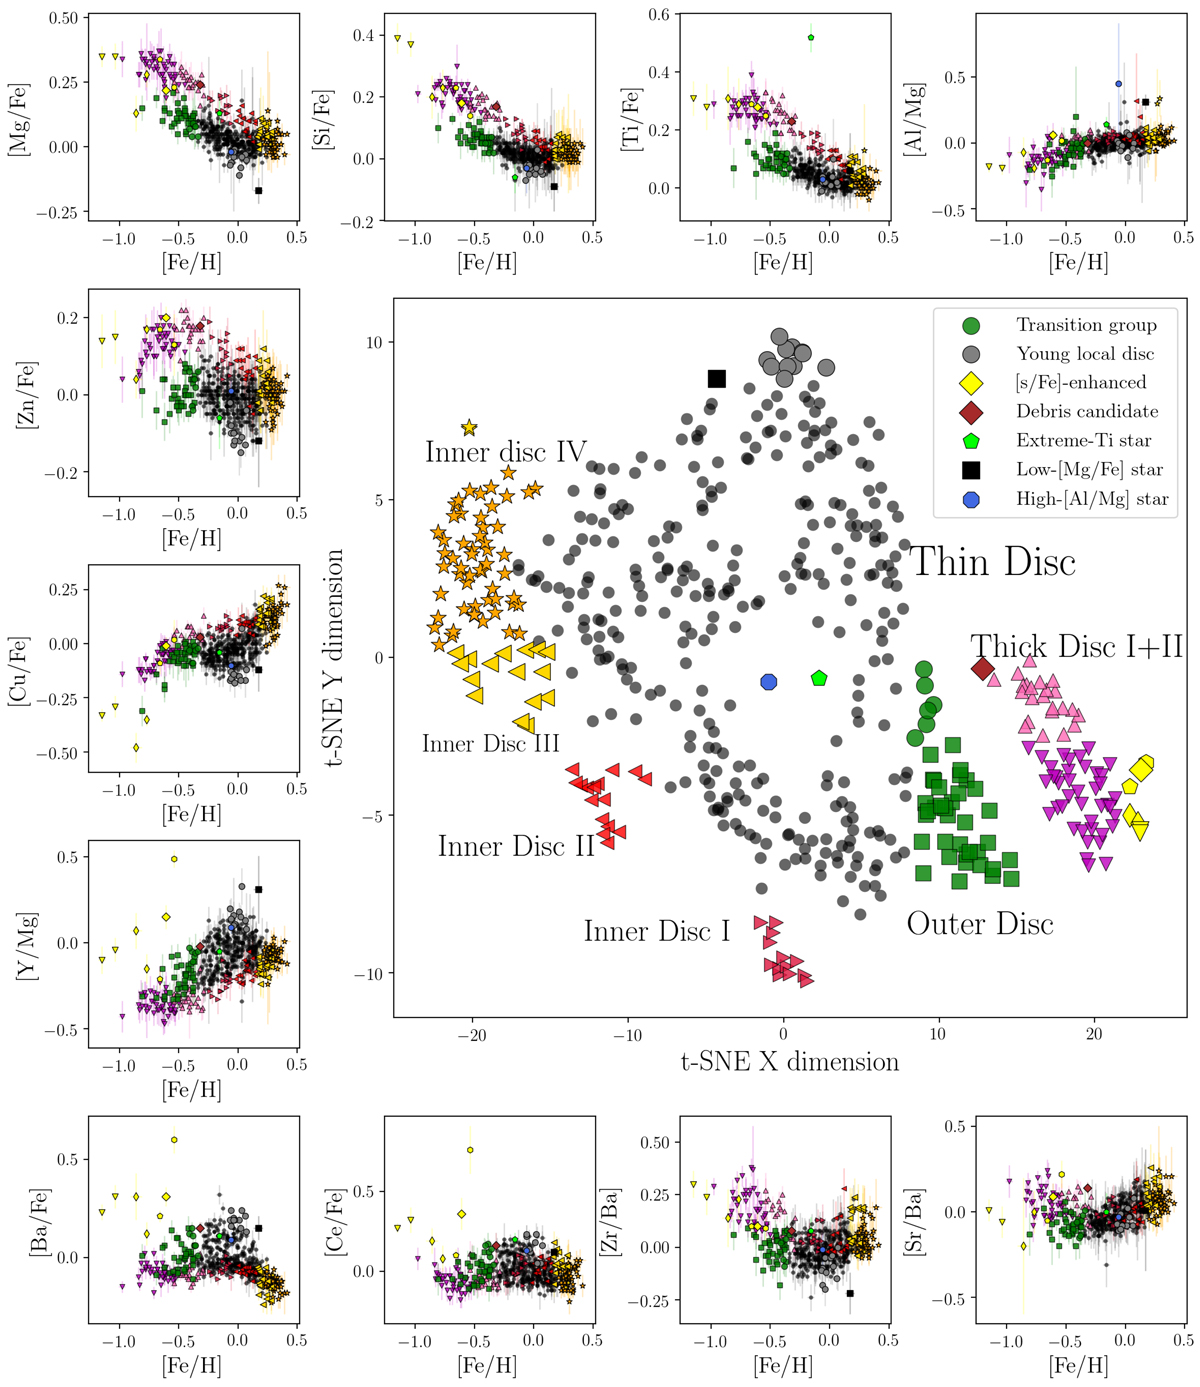
Illustration of how t-SNE works in abundance space, using the Delgado Mena et al. (2017) sample. The small panels show eleven of the possible ∼20 000 abundance diagrams that can be created from 13 elements. The resulting reference t-SNE projection of the full abundance space is shown in the big panel, and several identified sub-groups are indicated. For reference, the Sun would be found very close to the solar-abundance twin HD 212036 ([Fe/H] = −0.01, [X/Fe] = 0 + −0.05 for all measured elements X), which is located at (Xt − SNE, Yt − SNE) = (−4.57, 1.46).
Current usage metrics show cumulative count of Article Views (full-text article views including HTML views, PDF and ePub downloads, according to the available data) and Abstracts Views on Vision4Press platform.
Data correspond to usage on the plateform after 2015. The current usage metrics is available 48-96 hours after online publication and is updated daily on week days.
Initial download of the metrics may take a while.