Fig. 5.
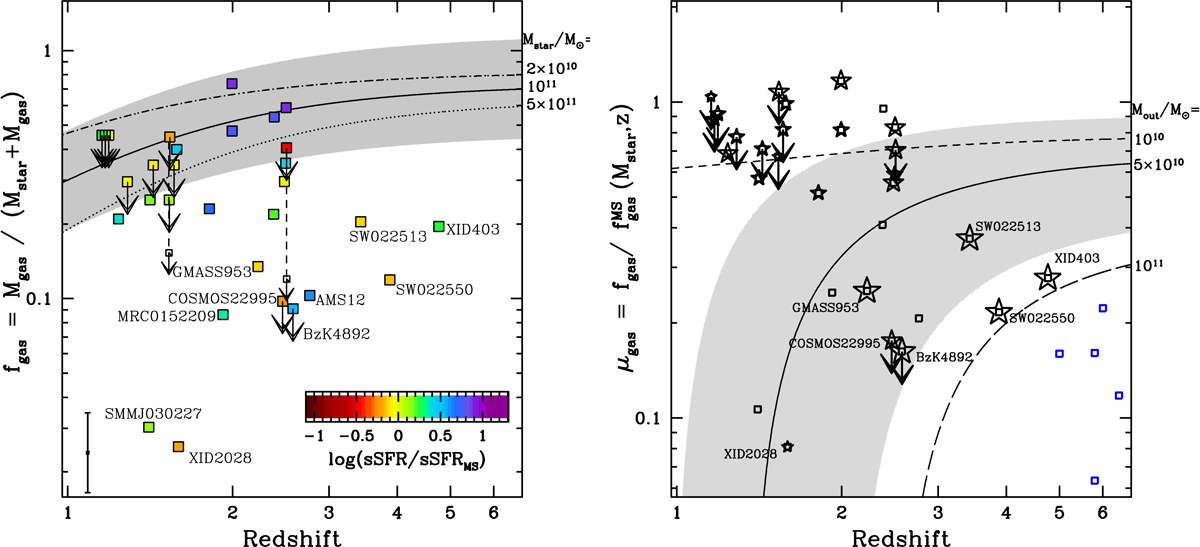
Left panel: redshift evolution of the gas fraction fgas for our sample of dusty AGN. The targets are colour-coded according to the distance from the main sequence of SFGs (see colour bar in the bottom right corner). For BzK8608 and CDF153 we also show (with open symbols) the upper limits we would obtain by assuming αCO = 0.8 instead of 3.6 (see Sect. 2). The predicted evolutionary trend of MS galaxies of Mstar = 1011 M⊙ from the 2-SFM model is shown with a solid curve (shaded area: 1σ scatter around average evolutionary trend line). We also show the predicted trends for MS galaxies of Mstar = 2 × 10¹⁰ M⊙ and Mstar = 5 × 10¹¹, as labelled in the figure. The error bar in the bottom left corner of the plot shows the representative 1σ error for the data points (we assume a 0.2 dex uncertainty for Mstar estimates; see Table C.2). Right panel: redshift evolution of the normalised gas fraction μgas for our sample of dusty AGN. The predicted evolutionary trend of “gas depleted” MS galaxies of Mstar = 1011 M⊙ is shown with the black curve (the shaded area indicates 1σ scatter around the average trend). This trend has been obtained in the framework of the 2-SFM model (Sargent et al. 2014) by considering the depletion of gas due to AGN-driven outflows (Mout = 5 × 10¹⁰ M⊙). We also display the predicted trends for Mout = 1010 and 1011 M⊙. The blue symbols refer instead to the predicted μgas of high-z unobscured QSOs from Valiante et al. (2014). The star symbols are associated with X-ray detected AGN and are identical to those used in Fig. 3. Essentially all obscured AGN hosts show a gas fraction deficit compared to normal galaxies, with CT QSOs (large star symbols) displaying some of the strongest deficits.
Current usage metrics show cumulative count of Article Views (full-text article views including HTML views, PDF and ePub downloads, according to the available data) and Abstracts Views on Vision4Press platform.
Data correspond to usage on the plateform after 2015. The current usage metrics is available 48-96 hours after online publication and is updated daily on week days.
Initial download of the metrics may take a while.