Fig. 2.
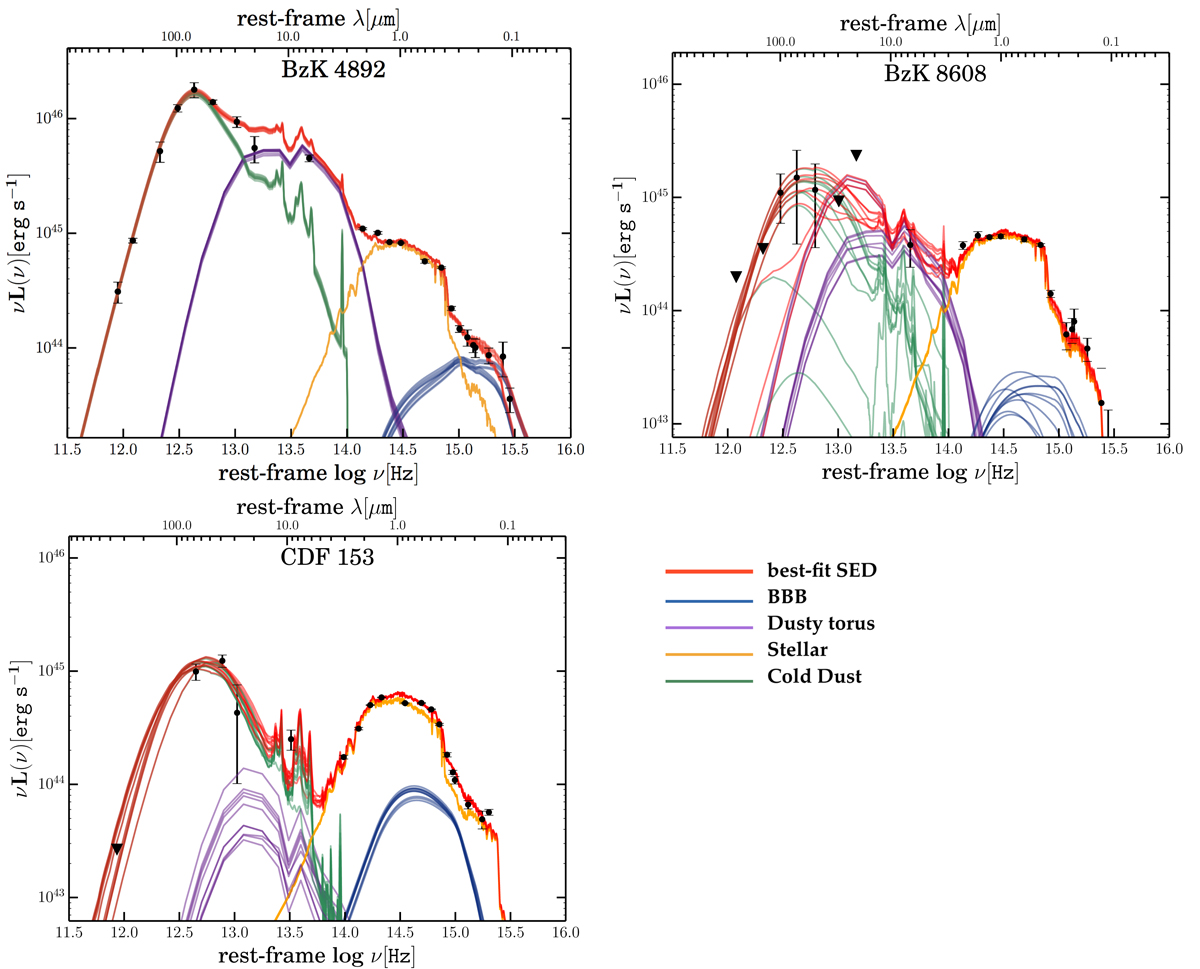
SED fitting of BzK4892 (top left panel), BzK8608 (top right panel), and CDF153 (bottom left panel). The black dots represent the observed data points from the Guo et al. (2013) and Wang et al. (in prep.) catalogues; 5σ upper limits are shown with black triangles. The data points at log(ν) ∼12 are from ALMA continuum observations at 250 GHz and 340 GHz (see Sect. 2). The best-fit SED obtained with AGNfitter (Calistro Rivera et al. 2016) and the different components used to model the SED are shown as labelled in the figure. Ten randomly picked realisations from the posterior distribution function are overplotted in the figures in order to visualise the dynamic range of the parameter values.
Current usage metrics show cumulative count of Article Views (full-text article views including HTML views, PDF and ePub downloads, according to the available data) and Abstracts Views on Vision4Press platform.
Data correspond to usage on the plateform after 2015. The current usage metrics is available 48-96 hours after online publication and is updated daily on week days.
Initial download of the metrics may take a while.