Fig. 8.
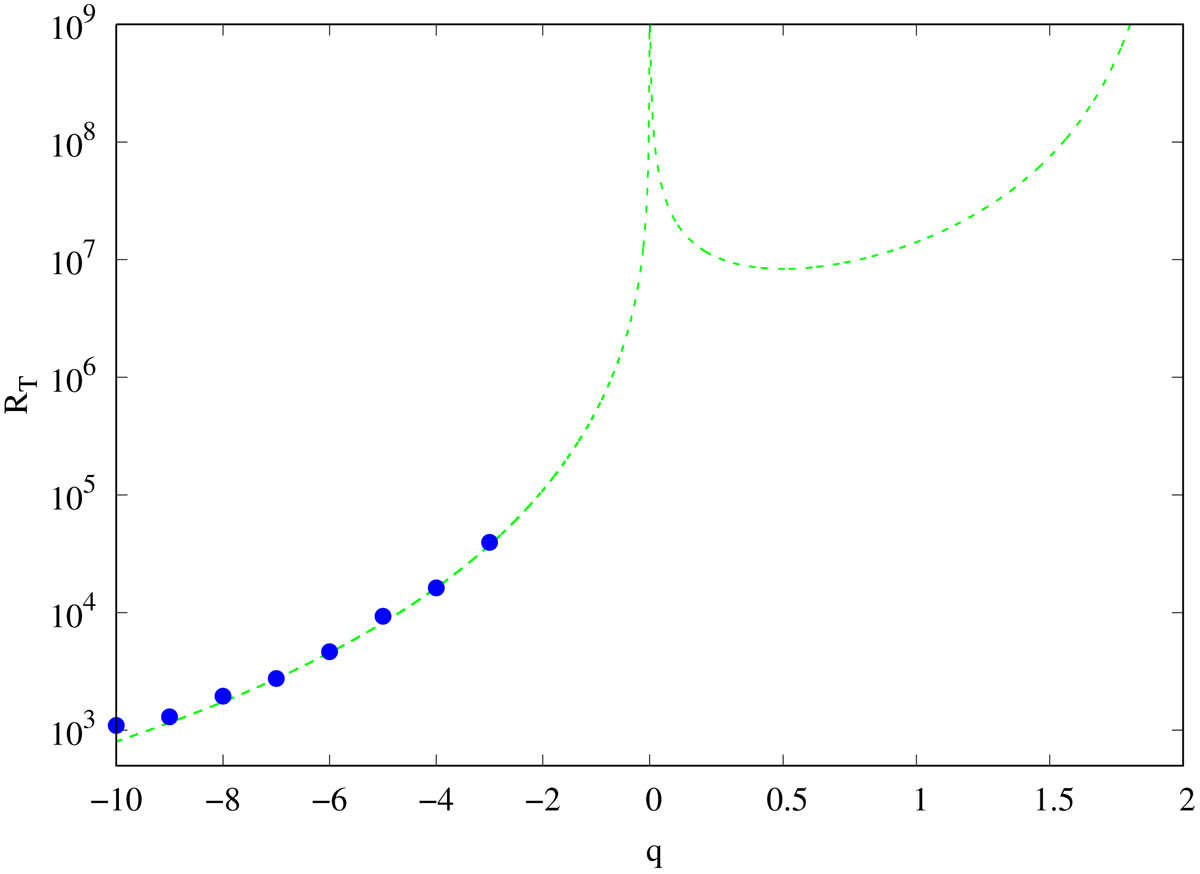
Rnl(q) along the constant maximum growth factor of the cross-rolls given by Eq. (69), where gz max/ϵ is obtained approximately using procedure (ii) introduced in Sect. 5. The circles represent DNS performed in this work using a tall box with box ratio lz = 2 (see Sect. 6 for details). The curve is matched to the circle at q = −4, which corresponds to RT = 16 250 (see Table 1).
Current usage metrics show cumulative count of Article Views (full-text article views including HTML views, PDF and ePub downloads, according to the available data) and Abstracts Views on Vision4Press platform.
Data correspond to usage on the plateform after 2015. The current usage metrics is available 48-96 hours after online publication and is updated daily on week days.
Initial download of the metrics may take a while.