Fig. 7.
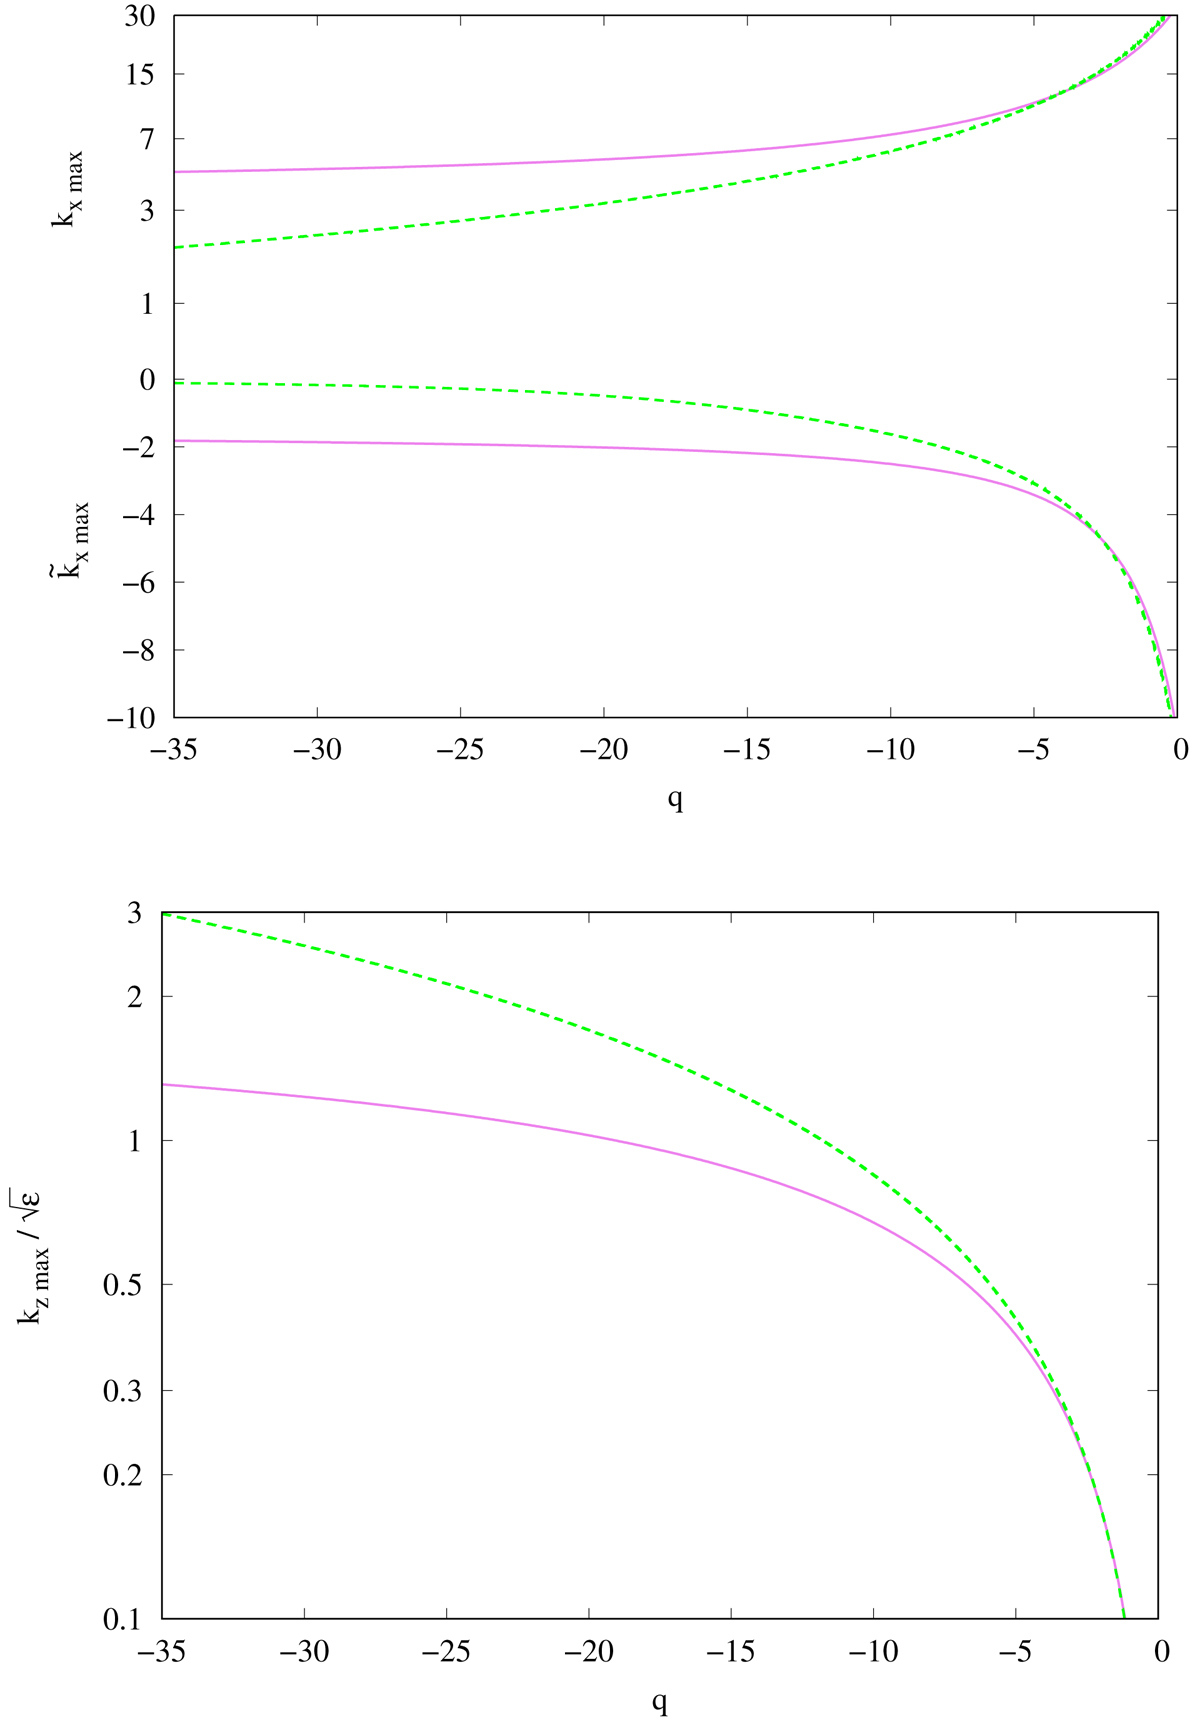
Top panel, solid lines: roots of the set of Eqs. (34)–(35) along Rnl(q) plotted on the top panel in Fig. 6 by the solid line; dashed lines: Eqs. (36) and (37) along Rnl(q) plotted on the top panel in Fig. 6 by the dashed line. Bottom panel, solid line: ![]() obtained from the condition (31) with kx = kx max and k̃x max along the corresponding solid lines on the top panel of this figure; dashed line: Eq. (40) along Rnl(q) plotted on the top panel in Fig. 6 by the dashed line.
obtained from the condition (31) with kx = kx max and k̃x max along the corresponding solid lines on the top panel of this figure; dashed line: Eq. (40) along Rnl(q) plotted on the top panel in Fig. 6 by the dashed line.
Current usage metrics show cumulative count of Article Views (full-text article views including HTML views, PDF and ePub downloads, according to the available data) and Abstracts Views on Vision4Press platform.
Data correspond to usage on the plateform after 2015. The current usage metrics is available 48-96 hours after online publication and is updated daily on week days.
Initial download of the metrics may take a while.