Fig. 6.
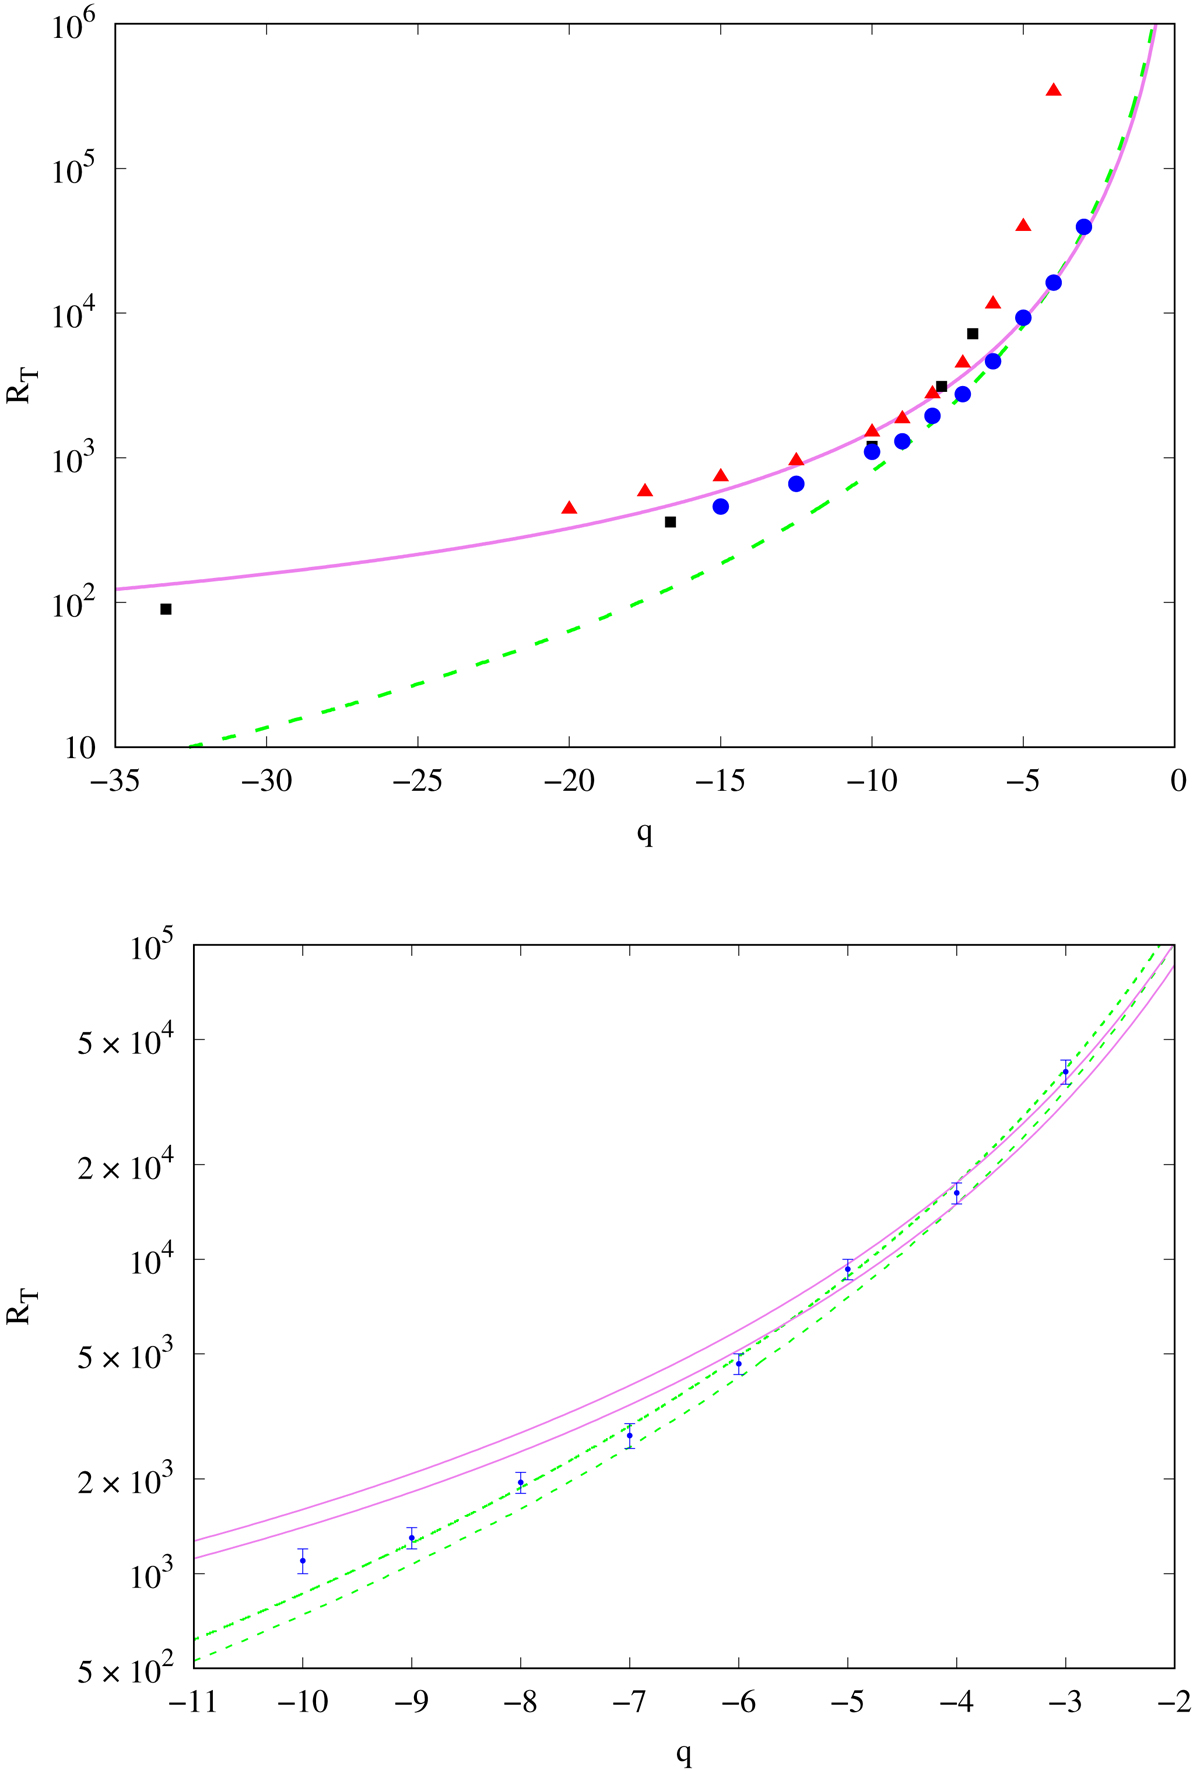
Transition Reynolds number RT versus shear rate q in the cyclonic regime. Top panel: (1) squares represent DNS by LL05, see their Fig. 4; (2) triangles represent DNS performed in this work employing a cubic box; (3) circles represent DNS performed in this work employing a tall box with box ratio lz = 2; (4) the solid curve shows Rnl(q) corresponding to constant maximum growth factor of the cross-rolls given by equation (69) and obtained using the procedure (i) introduced in Sect. 5; (5) the dashed curve shows the same as described in (4), but with gz max/ϵ obtained using the procedure (ii) introduced in Sect. 5; bottom panel: error bars for tall box DNS represented by circles on top panel are plotted in the range q = −10 ÷ −3 according to the values of Rdamp and Rturb given in Table 1. The corresponding solid and dashed lines represent the same as on top panel but for gz max/ϵ evaluated for RT(q = −4)=15 000 (lower lines) and for RT(q = −4)=17 500 (upper lines).
Current usage metrics show cumulative count of Article Views (full-text article views including HTML views, PDF and ePub downloads, according to the available data) and Abstracts Views on Vision4Press platform.
Data correspond to usage on the plateform after 2015. The current usage metrics is available 48-96 hours after online publication and is updated daily on week days.
Initial download of the metrics may take a while.