Fig. 1.
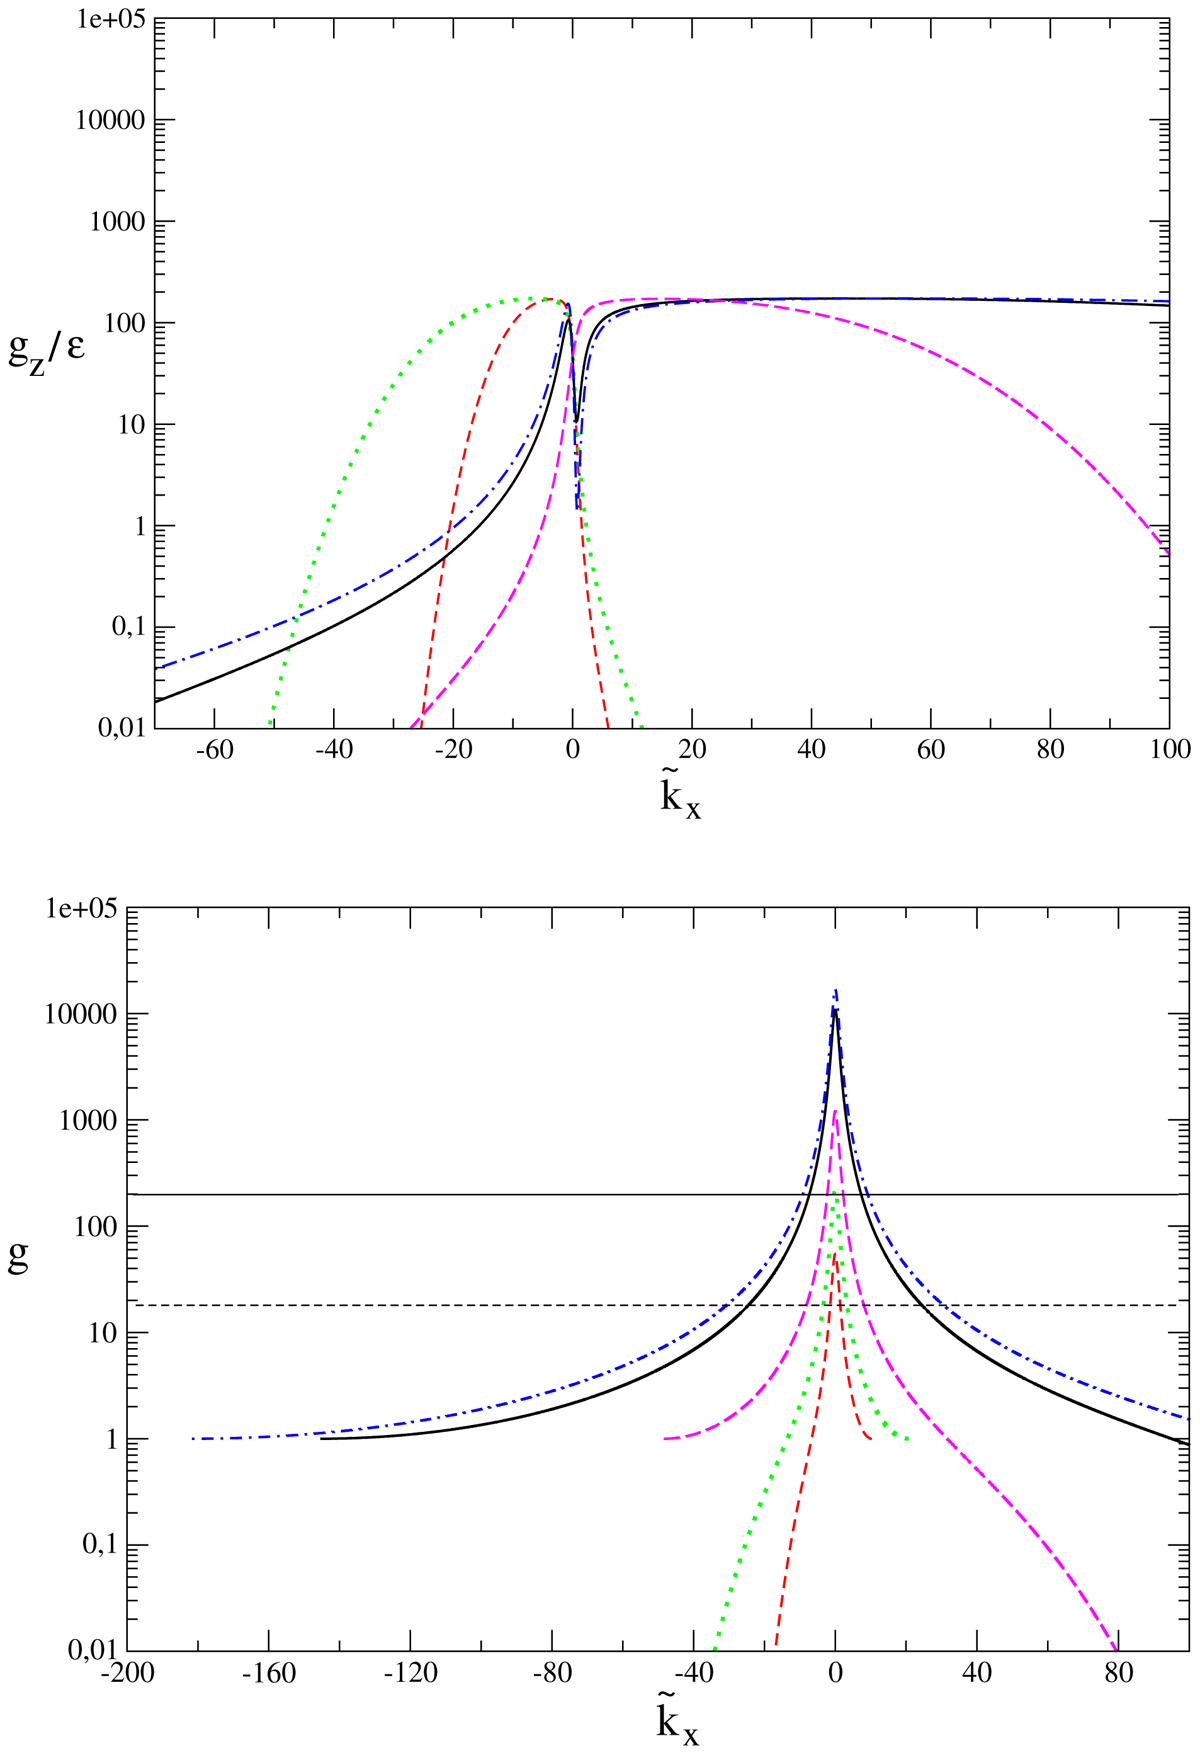
Short-dashed, dotted, long-dashed, solid, and dot-dashed curves: gz(k̃x) (top panel) and g(k̃x) (bottom panel) for transient growth of the particular SFH at q = −5, −1.5, 0.5, 1.5, and 1.6, respectively. In each case, kx and kz are chosen in such a way that SFH attains the constant value gz(k̃x max) = gz max ≈ 180ϵ (see Sect. 3.3 for definition of ϵ). This value of gz max/ϵ is obtained employing the procedure (ii) (see this section) in order to fit the transitional dependence RT(q) found in the tall box simulations of turbulence in the cyclonic regime (see Sect. 6) for details and the dashed curve on the top panel in Figs. 6 and 8. Solid and dashed horizontal lines on the bottom panel mark the value of corresponding gz max for ϵ = 1 and ϵ = 0.1, respectively.
Current usage metrics show cumulative count of Article Views (full-text article views including HTML views, PDF and ePub downloads, according to the available data) and Abstracts Views on Vision4Press platform.
Data correspond to usage on the plateform after 2015. The current usage metrics is available 48-96 hours after online publication and is updated daily on week days.
Initial download of the metrics may take a while.