Free Access
Fig. 5.
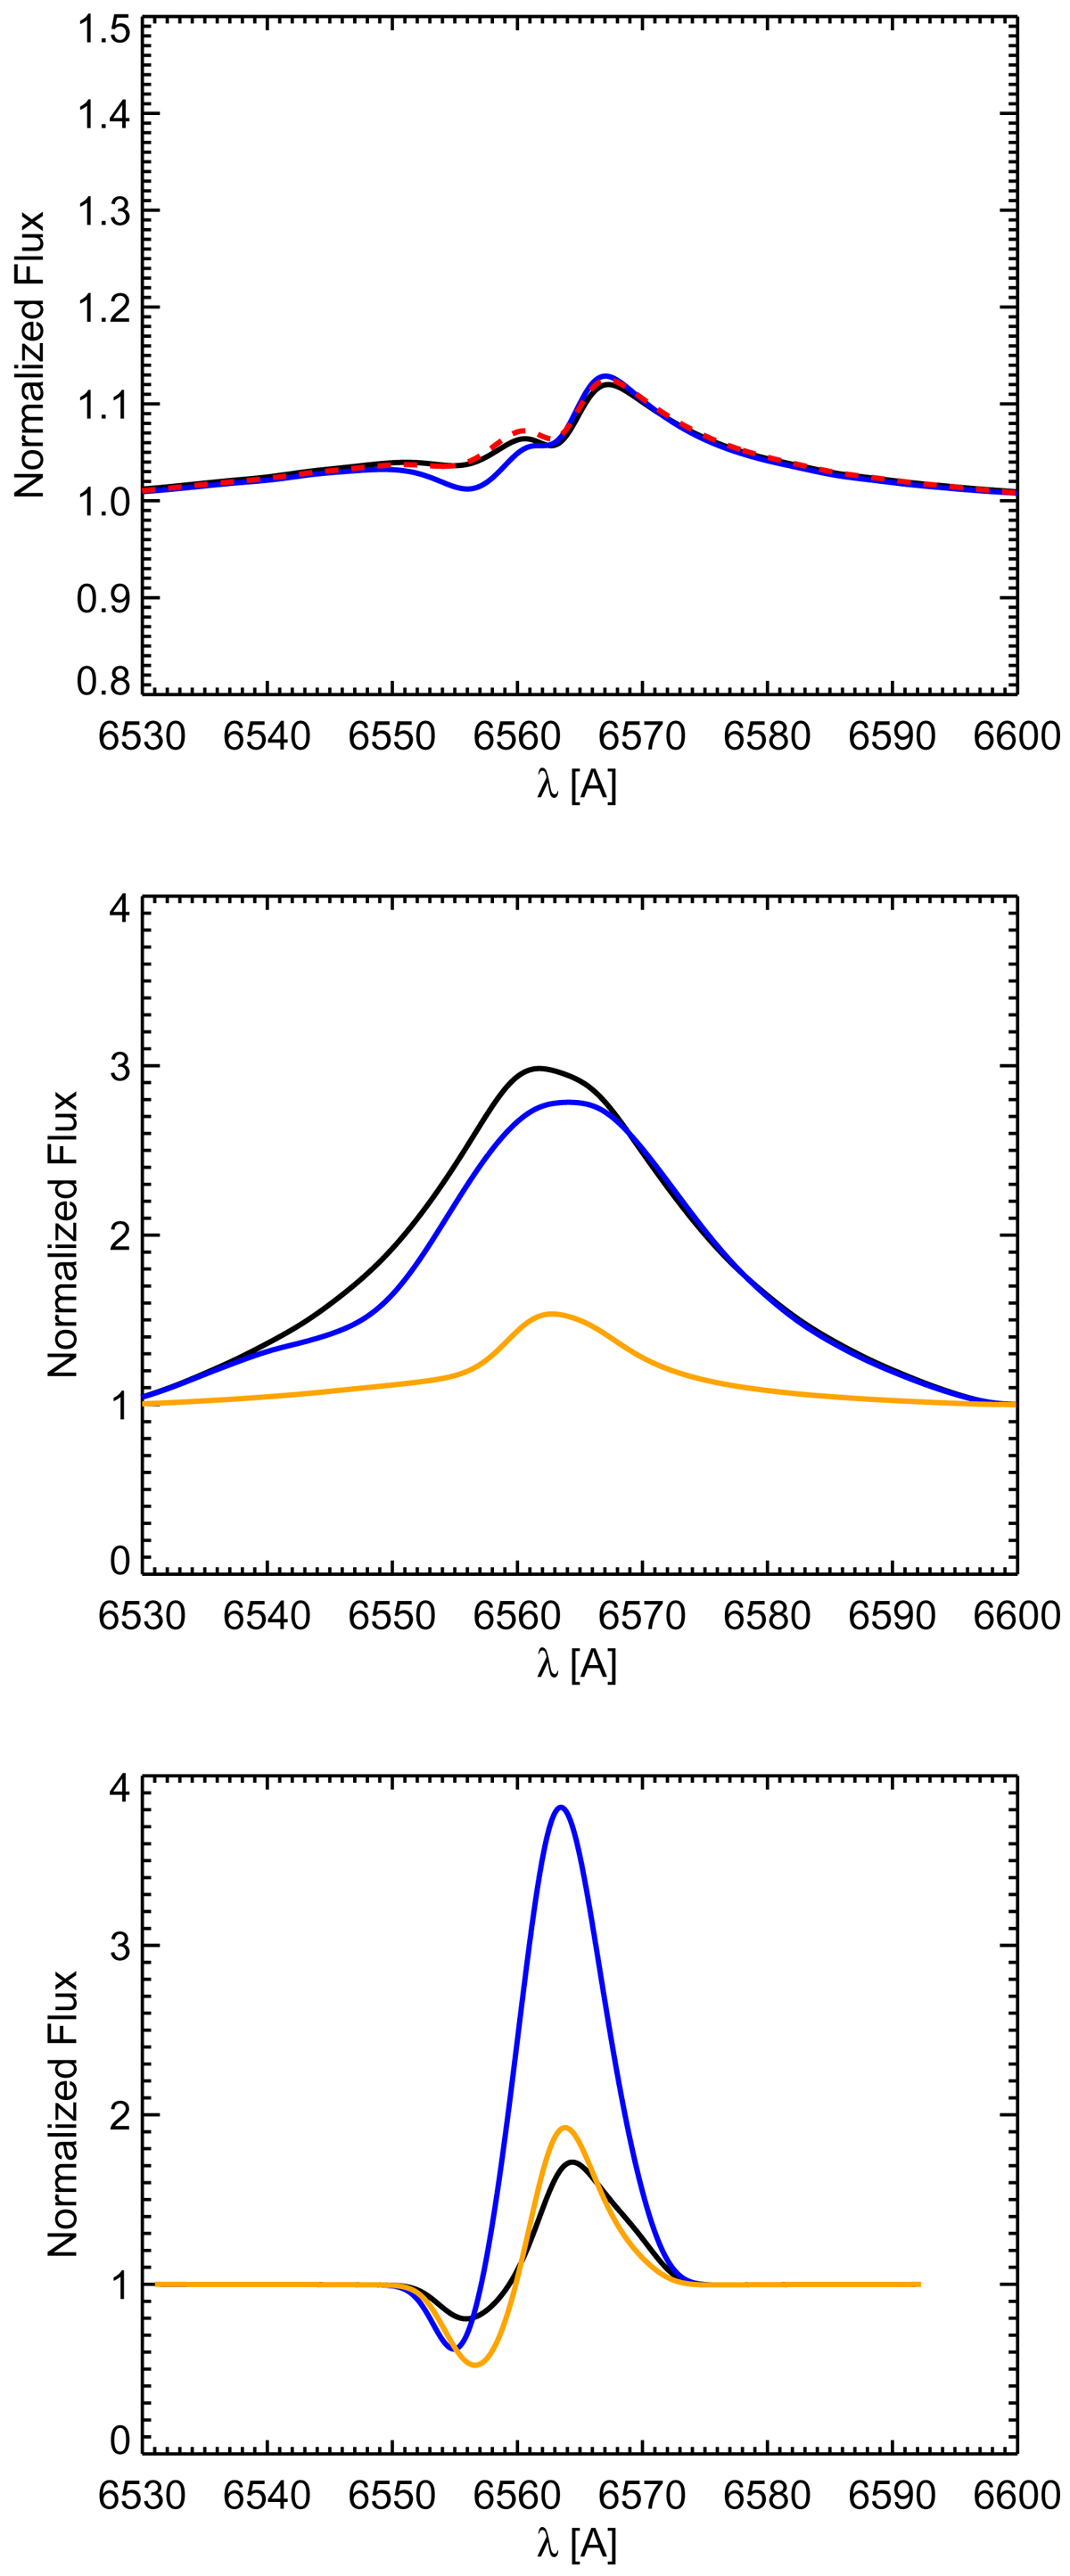
Modeled Hα line profiles. Profiles from the three ζ Pup like models in Table 1 are shown in the upper panel, with color coding as in Fig. 4. The middle and lower panels then display the O3 and B7 models in Table 1, respectively, with black lines showing models thick, blue lines models thin and orange lines models smooth.
Current usage metrics show cumulative count of Article Views (full-text article views including HTML views, PDF and ePub downloads, according to the available data) and Abstracts Views on Vision4Press platform.
Data correspond to usage on the plateform after 2015. The current usage metrics is available 48-96 hours after online publication and is updated daily on week days.
Initial download of the metrics may take a while.