Fig. 3.
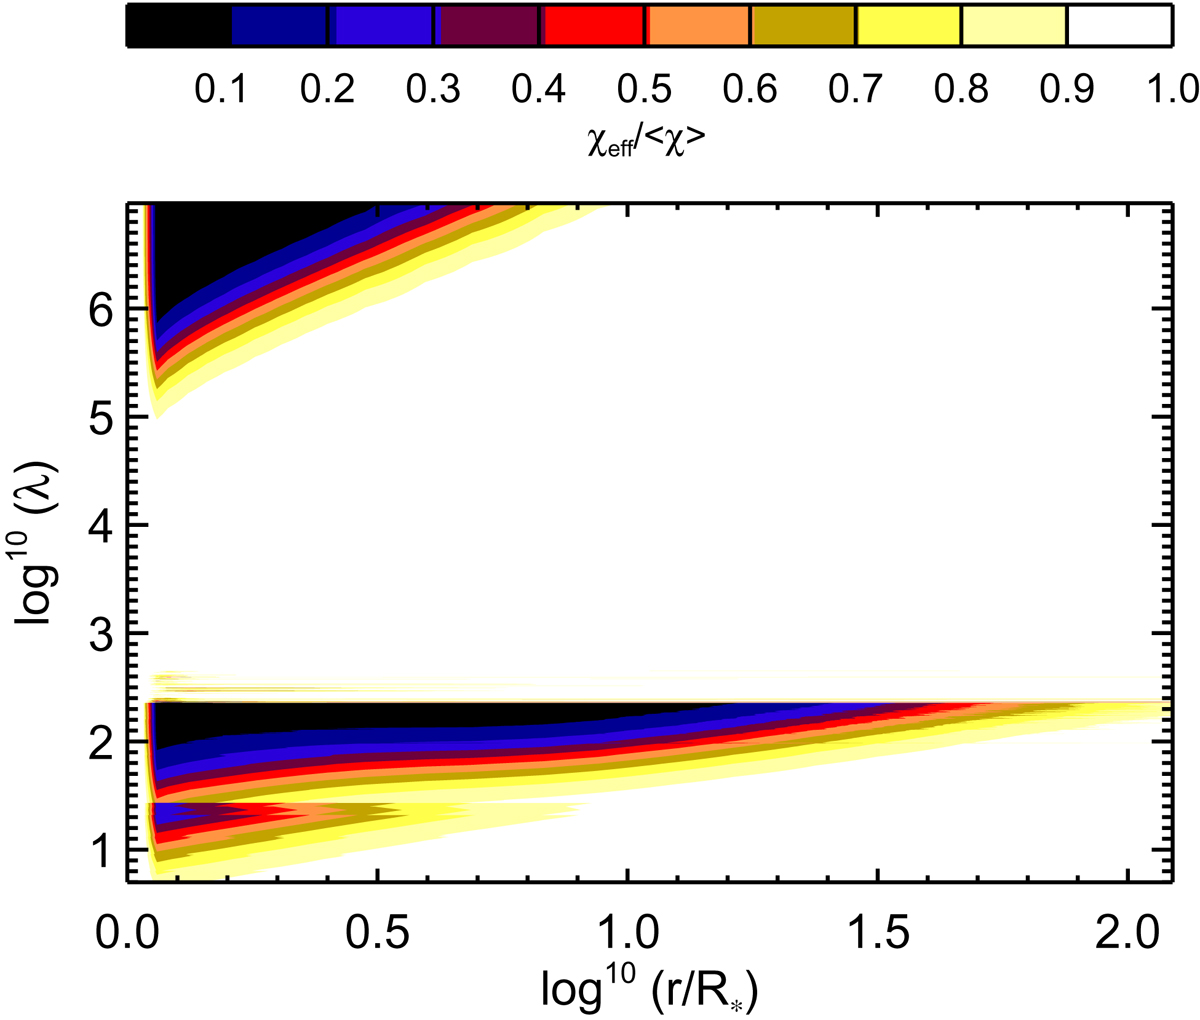
Contour plot of effective to mean opacity ratio, χeff/⟨ χ⟩, for complete background opacities (i.e., sum of background lines + total continuum, see text), displayed as function of radius (abscissa) r/R* = 1 − 100 and the full considered wavelength range (ordinate) between 5 and 107 Å. Colors range between no opacity-reduction 1 (white) and the limiting value fic = 0.01 (black). Parameters according to ζ Pup like model thick1 in Table 1.
Current usage metrics show cumulative count of Article Views (full-text article views including HTML views, PDF and ePub downloads, according to the available data) and Abstracts Views on Vision4Press platform.
Data correspond to usage on the plateform after 2015. The current usage metrics is available 48-96 hours after online publication and is updated daily on week days.
Initial download of the metrics may take a while.