Fig. 1.
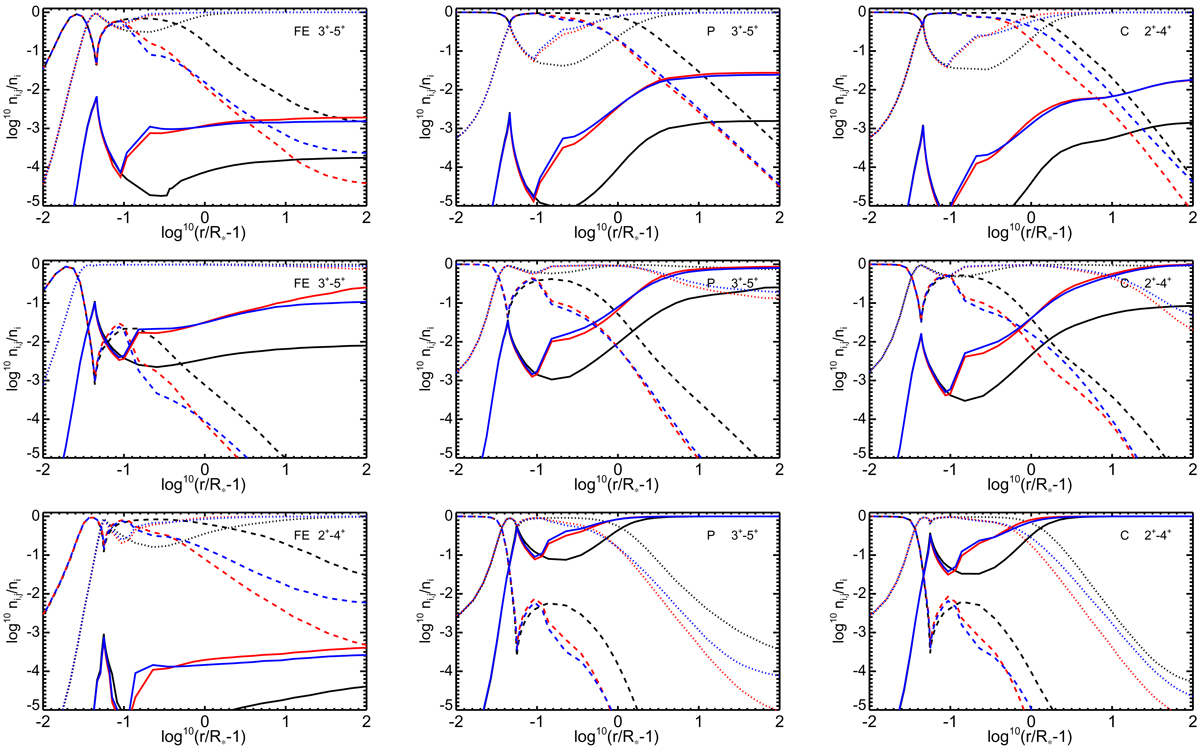
Ionization balance of selected elements iron (Fe), phosphorus (P), and carbon (C) for FASTWIND models “O1” (top panels), “O2” (middle panels), and “O3” (lower panels) with parameters according to Table 1. Plotted in each panel are number density ratios log nj/ni for ion stage j of species i, with ni the total element abundance, as function of a radius coordinate log10(r/R* − 1). Blue lines are models “thick” including full effects of porosity in physical and velocity space; red lines are models “thin” assuming optically thin clumping; black lines are models “smooth” without any wind clumping. For iron (left panels), phosphorus (middle panels), and carbon (right panels), the displayed states are given in the upper right of each panel; solid lines then show the ion fraction in the lowest considered state j, the dotted lines show state j + 1 and the dashed ones j + 2. (For example the top left panel thus shows Fe 3+ − 5+ = Fe IV − VI in models O1 “thick” (blue), “thin” (red) and “smooth” (black), where solid lines are ion fractions of Fe IV, dotted lines of Fe V, and dashed lines of Fe VI.)
Current usage metrics show cumulative count of Article Views (full-text article views including HTML views, PDF and ePub downloads, according to the available data) and Abstracts Views on Vision4Press platform.
Data correspond to usage on the plateform after 2015. The current usage metrics is available 48-96 hours after online publication and is updated daily on week days.
Initial download of the metrics may take a while.