Fig. 6
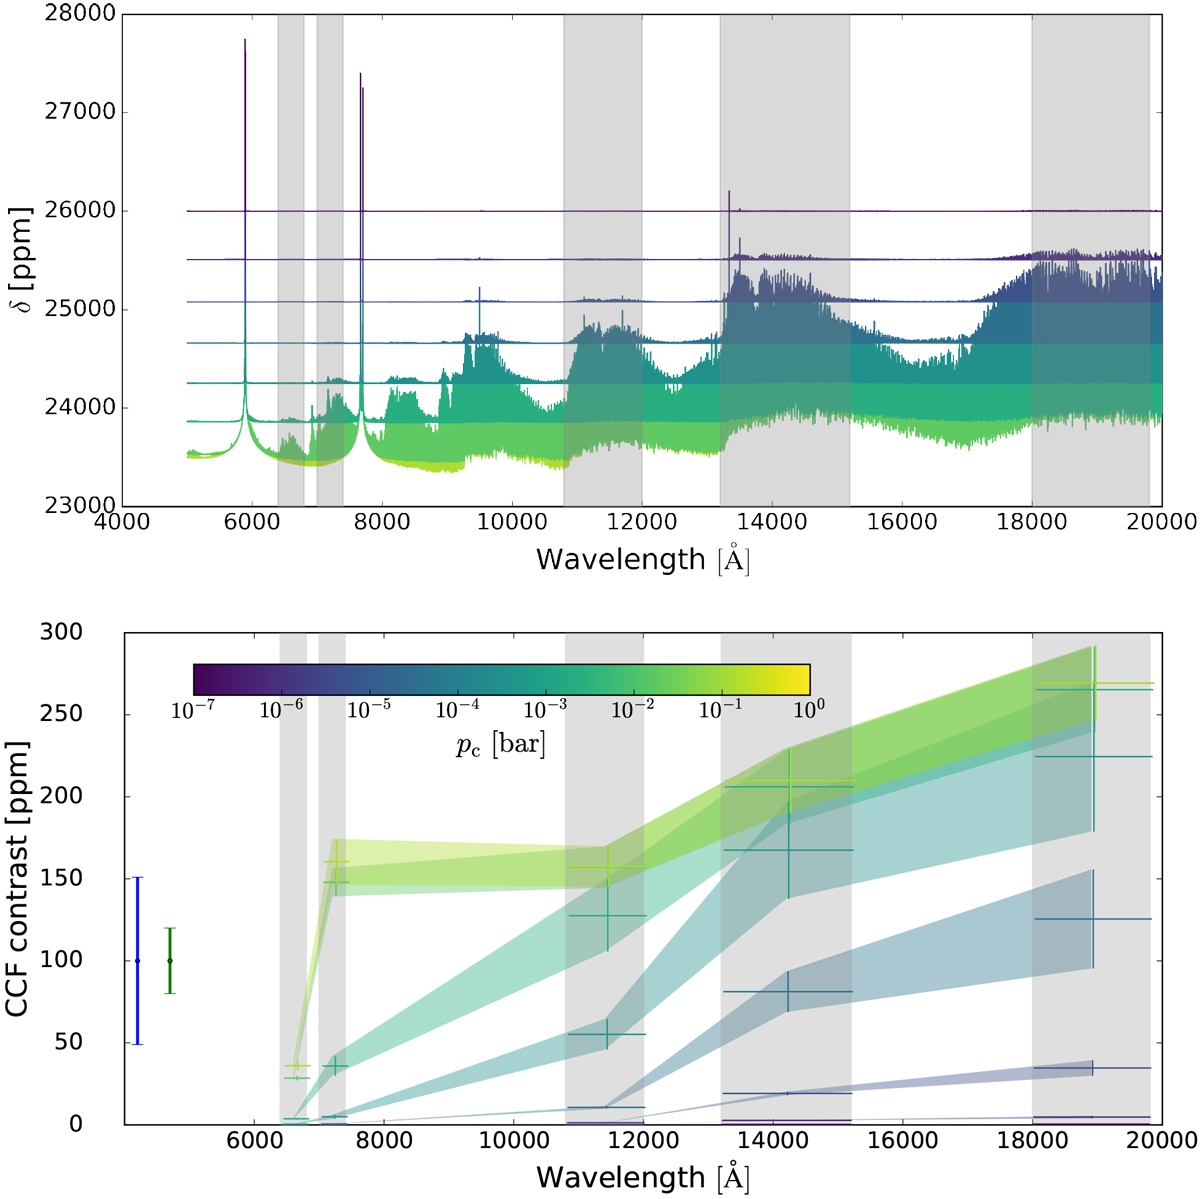
Results in the ideal case. Upper panel: high-resolution models of a hot Jupiter with T = 1700 K and differentvalues of pc, ranging between 10−7 and 1 bar. Each colour corresponds to a different value of pc, and the lightest colours correspond to condensates deeper in the atmosphere. Lower panel: CCF contrast as a function of wavelength. The colours are in correspondence with the models shown in the upper panel. For each value of pc, the temperature range 1200–2300 K is explored. We indicate with a vertical error bar the induced variation in the contrast of the CCF. On the left, the 1-pixel, 1σ precision of HARPS (blue) and ESPRESSO (green) for a single transit are shown. These error bars only account for photon noise, but telluric residuals may introduce additional noise (see Appendix A). The NIR bands must be accessed from space or from the stratosphere. Such instruments do not yet exist, and we do not estimate an error bar.
Current usage metrics show cumulative count of Article Views (full-text article views including HTML views, PDF and ePub downloads, according to the available data) and Abstracts Views on Vision4Press platform.
Data correspond to usage on the plateform after 2015. The current usage metrics is available 48-96 hours after online publication and is updated daily on week days.
Initial download of the metrics may take a while.