Fig. 3
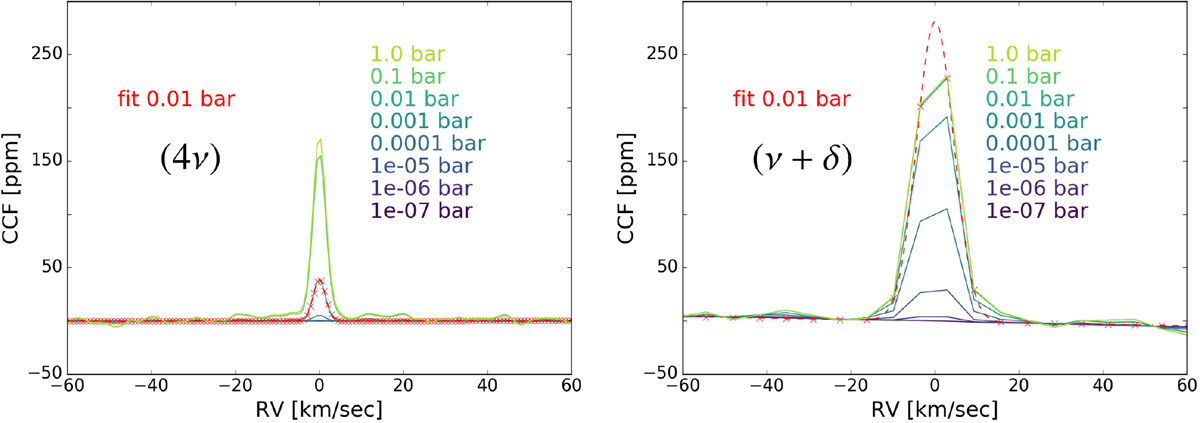
CCFs for the ![]() and
and ![]() bands as observed with ESPRESSO and GIANO, respectively. We arbitrarily offset the CCFs to place their continuum at 0. Solid lines of different colours from purple to light green show the CCF obtained for a grey aerosol deck located at the pressure indicated in the colour-matched label. A red dashed line shows the best Gaussian fit to the pc = 0.01 mbar case. Red crosses indicate the best fit at the sampling corresponding to the simulation, finer for ESPRESSO, coarser for GIANO.
bands as observed with ESPRESSO and GIANO, respectively. We arbitrarily offset the CCFs to place their continuum at 0. Solid lines of different colours from purple to light green show the CCF obtained for a grey aerosol deck located at the pressure indicated in the colour-matched label. A red dashed line shows the best Gaussian fit to the pc = 0.01 mbar case. Red crosses indicate the best fit at the sampling corresponding to the simulation, finer for ESPRESSO, coarser for GIANO.
Current usage metrics show cumulative count of Article Views (full-text article views including HTML views, PDF and ePub downloads, according to the available data) and Abstracts Views on Vision4Press platform.
Data correspond to usage on the plateform after 2015. The current usage metrics is available 48-96 hours after online publication and is updated daily on week days.
Initial download of the metrics may take a while.