Fig. 11
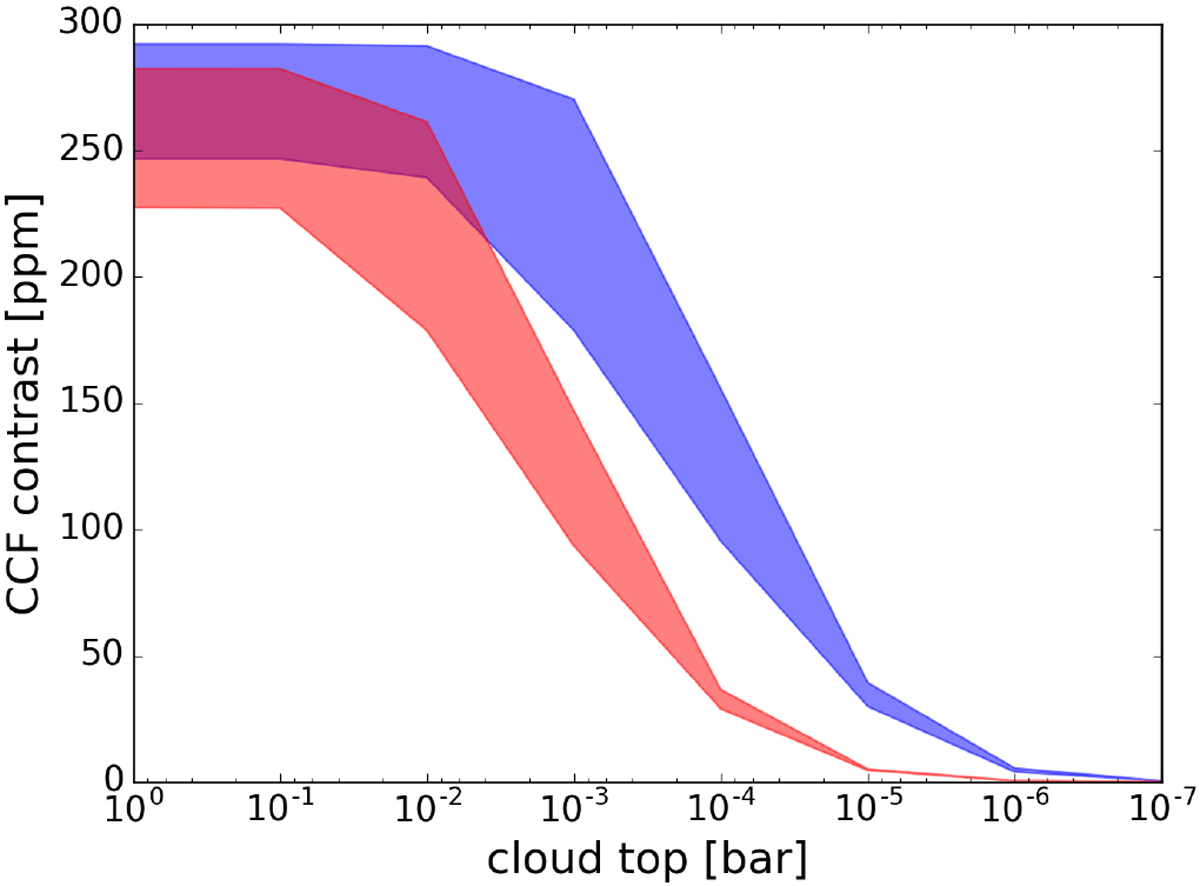
Contrast of the CCF of the ![]() band, observable with GIANO, as a function of altitude of aerosols, expressed as pressure of the cloud top. The shadowed area is spanned by the models when the temperature is varied between 1200 and 2300 K. A sharp decrease in the contrast of the CCF is caused by aerosols higher than a critical pressure. For solar water abundance, this threshold is located at about 10−3 bar (blue curve). For 0.1 times solar abundance, this threshold is located at about 10−2 bar (red curve), thus 10 times deeper in the atmosphere.
band, observable with GIANO, as a function of altitude of aerosols, expressed as pressure of the cloud top. The shadowed area is spanned by the models when the temperature is varied between 1200 and 2300 K. A sharp decrease in the contrast of the CCF is caused by aerosols higher than a critical pressure. For solar water abundance, this threshold is located at about 10−3 bar (blue curve). For 0.1 times solar abundance, this threshold is located at about 10−2 bar (red curve), thus 10 times deeper in the atmosphere.
Current usage metrics show cumulative count of Article Views (full-text article views including HTML views, PDF and ePub downloads, according to the available data) and Abstracts Views on Vision4Press platform.
Data correspond to usage on the plateform after 2015. The current usage metrics is available 48-96 hours after online publication and is updated daily on week days.
Initial download of the metrics may take a while.